Monitor all mobility on a single platform
With Mobility Analytics, access a turnkey platform of multi-source and multi-mode indicators to build an integrated mobility policy.
REQUEST A DEMOWhat is SaaS Mobility Analytics software used for?
As a Public Transport Authority, you can use Mobility Analytics to understand the movements in your territory in detail according to the modes of mobility. This platform simplifies the collection and processing of data from public transport, bicycles, transport on demand, park and ride, and more. By doing so, you can create an integrated mobility policy and promote modal shift.
As a Public Transport or Mobility Operator, you can use Mobility Analytics to spend more time on the continuous analysis and optimization of your modes, and less time processing data and writing reports. You can communicate effectively with your principal to strengthen the relationship of trust between you. You will also be able to collaborate more easily with operators from other modes and design complementary, multimodal offers.
Facilitate the modal shift from the private car to soft and shared mobility
- Access a unique, turnkey mobility platform that centralizes all multi-source and multi-mode data and indicators;
- Design and manage a coherent and integrated mobility policy, facilitating intermodality;
- Track travel in your area and facilitate the complementarity of offers, to make soft and shared mobility preferable to the car.

Features: Everything you can do with Mobility Analytics
Gather all the mobilities of your territory
Analyze movements in details

Coordinate easily various mobilities

Easily communicate with stakeholders
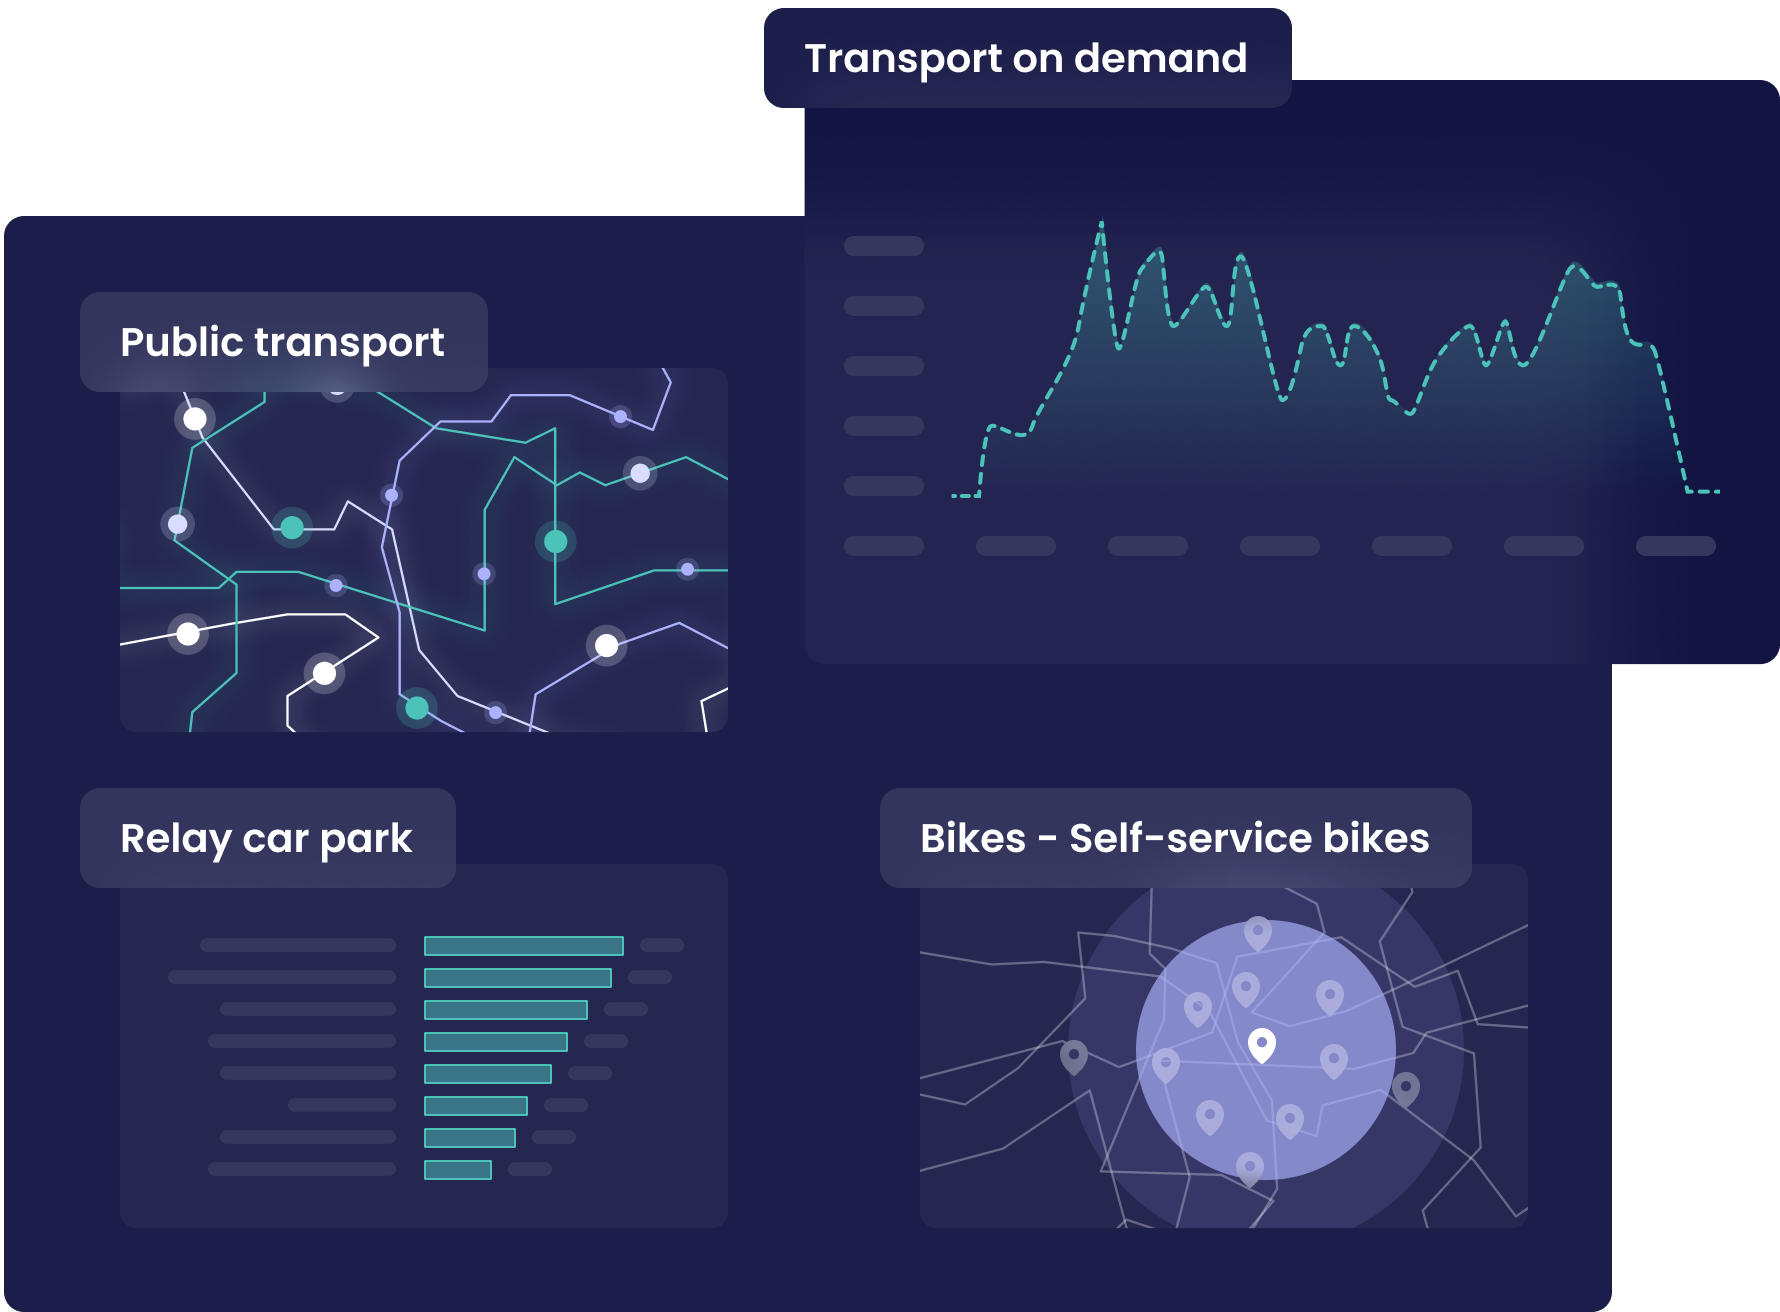
Public transport, bicycles and self-service bicycles, transport on demand, park and ride: monitor the indicators of mobility modes in your area.
All the data on these modes becomes easily usable, viewable, shareable. You will be able to measure the impact of your public policies more easily and independently in terms of soft and shared mobility, and build an integrated and coherent policy.
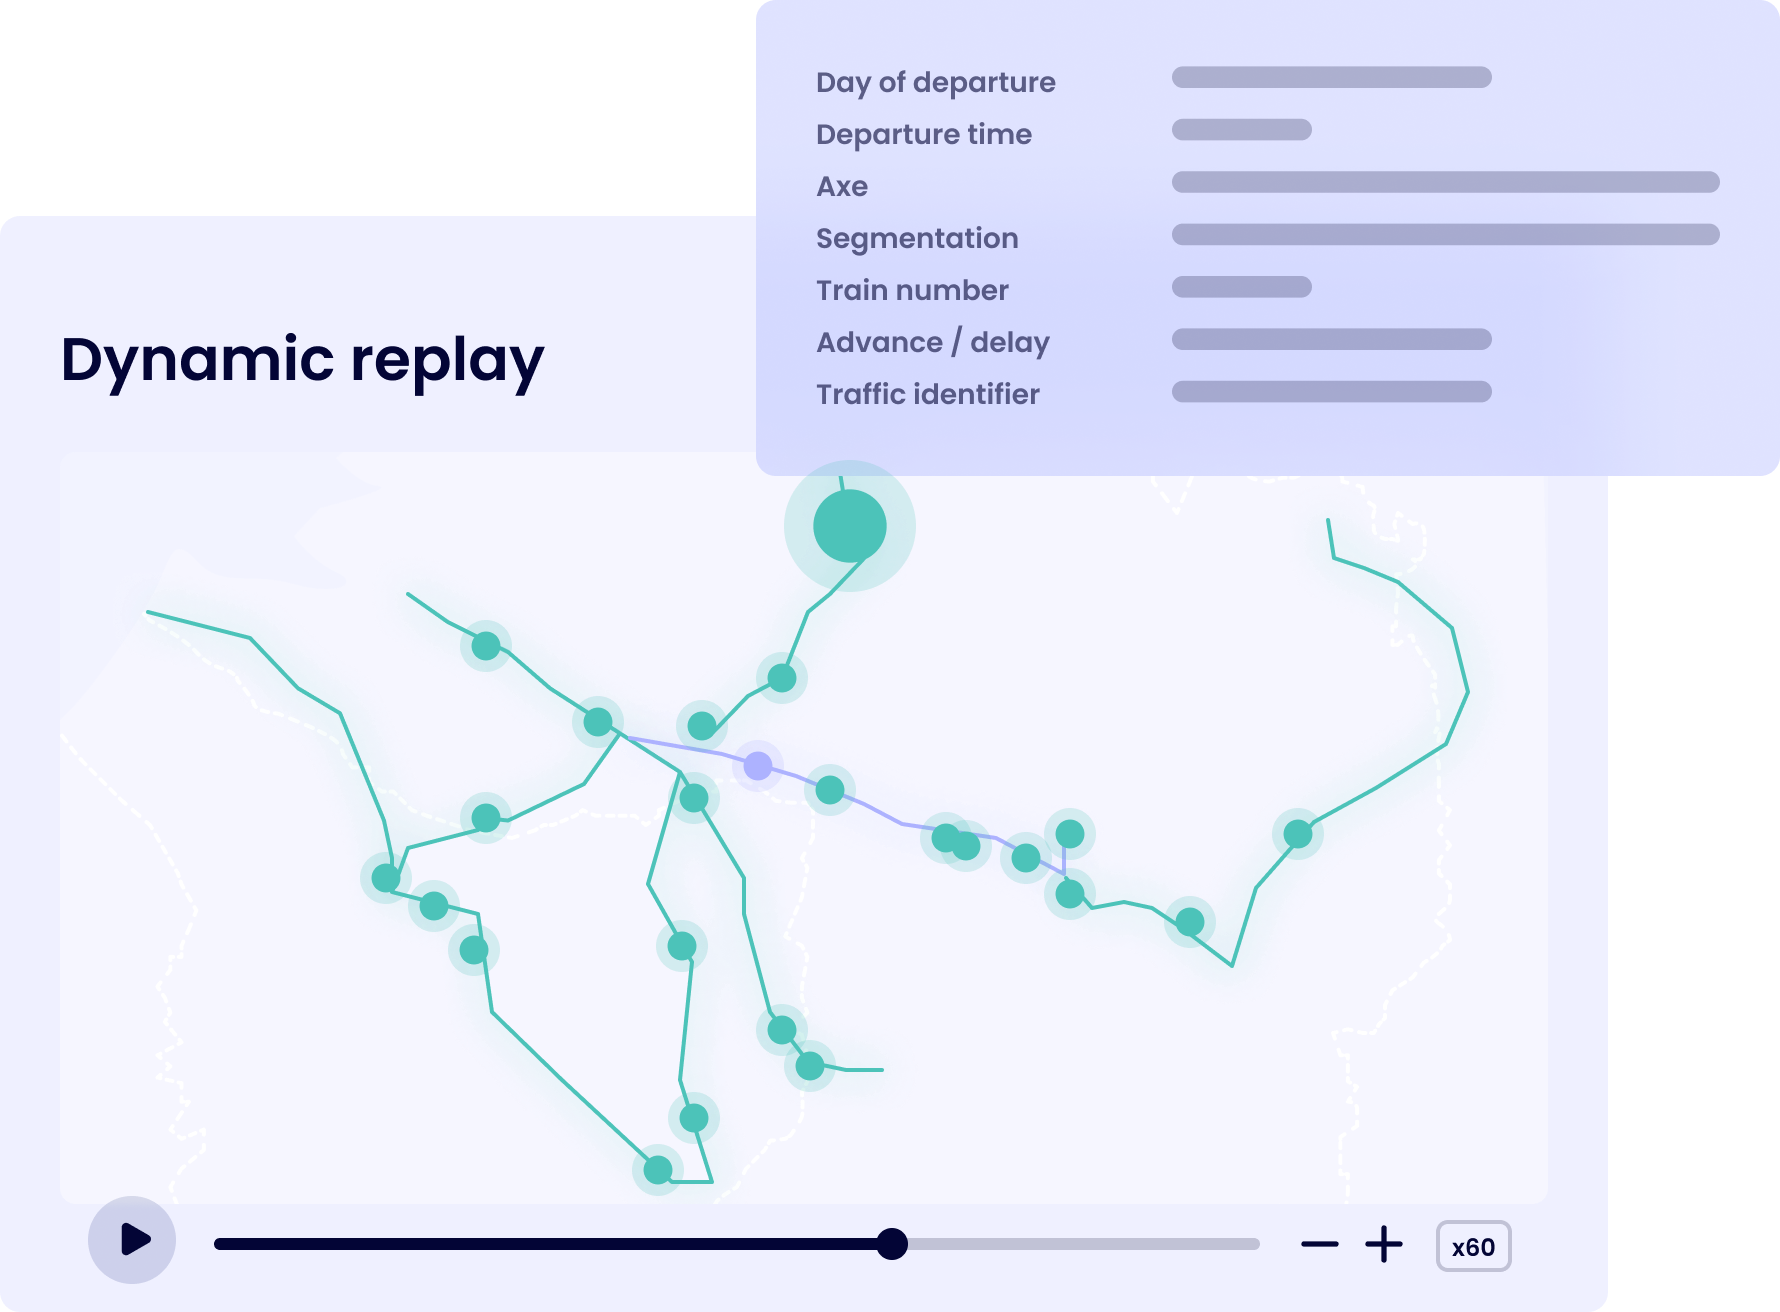
Offer yourself the possibility of analysing in a very detailed way the movements and the use of each mode, on our unique dynamic data platform, available 7 days a day. You will also have a global vision of soft and shared mobility in your area.
Save time in travel analysis, and thus improve your mobility offer by identifying underserved areas, and adapting supply to the potential demand of each area.
Use a single tool to manage the activity of mobility operators in your territory. You will have access to the various reports with up-to-date and dynamic data, and at a glance.
Thanks to Mobility Analytics, save time in the collection and processing of data, standardize reporting on the different modes, monitor the performance of operators and optimize travel times to facilitate the modal shift from the individual car.
Communicate transparently, and with all stakeholders. Mobility Analytics gives access to an objective reality, based on data, which can be shared with stakeholders and the various operators in the territory.
Promote dialogue between public transport authorities and mobility operators in your territory, and make the best decisions in a reactive and joint way, on the basis of a shared reality.
The benefits of Mobility Analytics
Understand: analyze journeys according to the mode
Coordinate: a tool to manage operator activity
Easily communicate with stakeholders
Monitor the modal shift objective on a daily basis
Facilitate the complementarity of modes, intermodality
Why Mobility Analytics ?
Mobility Analytics makes it possible to no longer be encumbered with different tools and reports from the different mobility operators on its territory. The tool offers the possibility of having a detailed understanding of travel flows on the different modes as well as an overview at a glance, and thus of creating an integrated mobility offer.
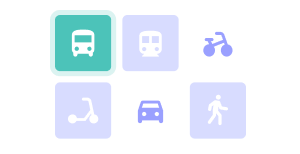
4 modes that can be quickly integrated
1 platform, all forms of mobility
Access your dynamic reports
Our other solutions
With Transport Analytics, you can dynamically monitor a large amount of public transport indicators 24/7. You may use them to optimize offers and operations. You can also continuously follow precisely the evolution of origin-destination data, with a large spatio-temporal framework.
Rail Analytics is a unique platform allowing regions to optimize their regional train offers: monitor network traffic to better adapt offers, ensure the right allocation of rolling stock, anticipate purchase of new equipment, and monitor the quality of production as well as the execution of the offer.
With Fraud Tracker, dynamically follow the evolution of fraud and obtain a more accurate analysis than with field surveys, thanks to the cross-referencing of counting and ticketing data. Thanks to our predictions, facilitate your teams’ work and optimize controls.
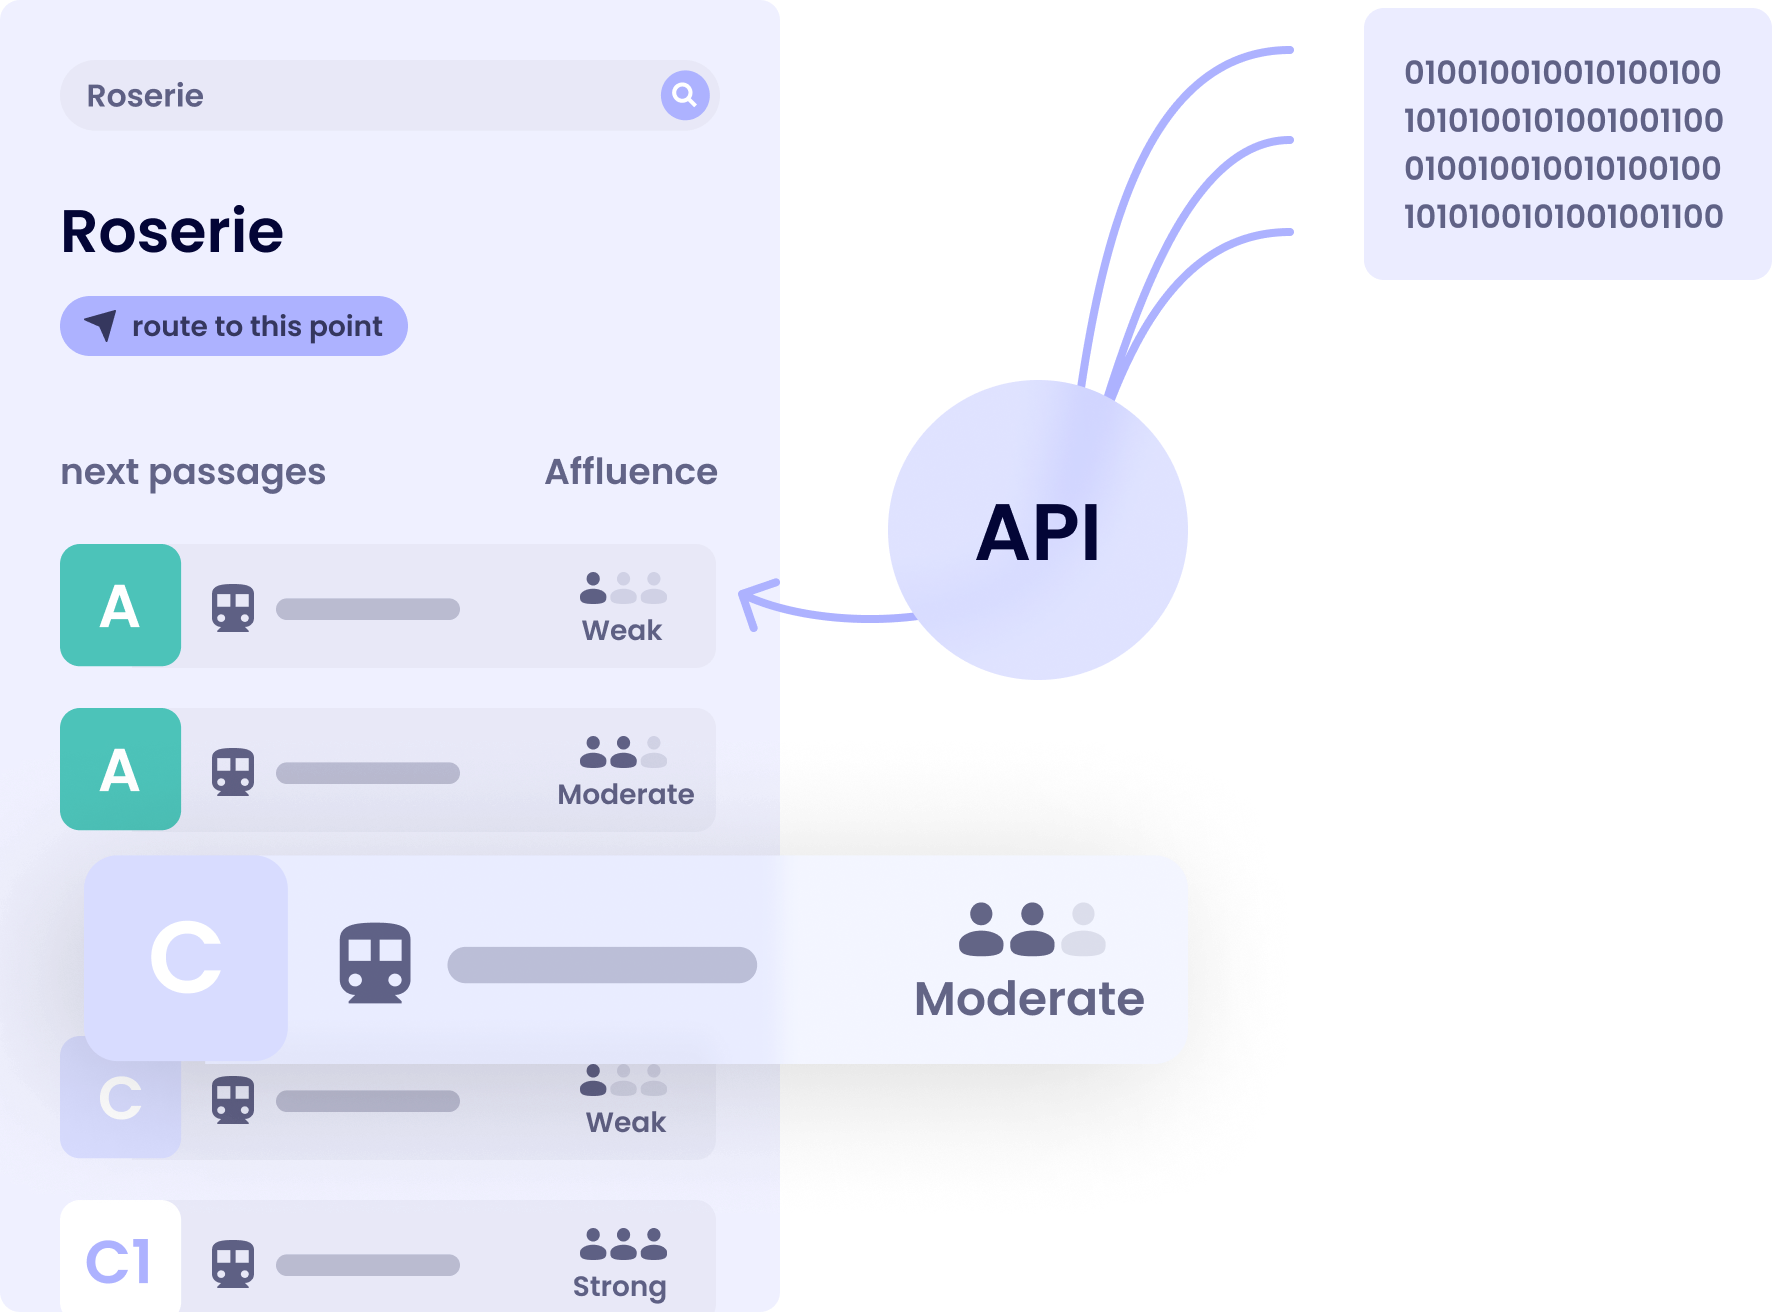
Occupancy API, easy to integrate into a mobile app, improves passenger comfort, and therefore the network attractiveness, by providing reliable information on the number of on-board passengers. This data is used by users to plan routes, and allows the public transport authority and operator to regulate traffic.
With Transport Planner, find and test the optimal transport offer: identify at a glance overloaded routes, places and times when the network is saturated, and test optimization hypotheses by increasing the frequency and comparing various service adaptation scenarios.