Adapt the offer to the demand for mobility
With Transport Planner, test scenarios by changing timetables and bus capacities, and find the perfect match between mobility supply and demand.
REQUEST A DEMOWhat is the SaaS Transport Planner software used for?
Transport Planner is a unique platform that allows communities to identify areas of over- or under-use on the network, to help you determine the most suitable offer according to your criteria(km, price, passenger comfort, etc.) to optimize the use of resources and the transport offer.
The software makes it possible to identify at a glance overloaded routes, places and times when the network is saturated, and test optimization hypotheses by increasing the frequency and comparing various service adaptation scenarios.
Diagnostiquer votre offre, et créer des scénarios d’adaptation de celle-ci
The SaaS Transport Planner software makes it more agile to design and adapt a theoretical transport offer. It makes it possible to understand network traffic very quickly and in detail, and to create and test scenarios in a simple and intuitive way, by analyzing the effects on costs and quality of service.
CONTACT US TO KNOW MORE
Features: Everything you can do with Transport Planner

Analyze network use by time of day and line
Reduce costs and improve quality
Create alternate scenarios
Test the scenarios and compare them with each other
The Diagnosis module gives an overall view of the use of a transport network. It makes it possible to easily identify the phenomena of saturation of this network by exploring several scales: time slot, period of the year, line and direction.
This module uses the load recreated from ticketing data. It allows traffic to be analyzed both by period of the year and by time slot, but also by line and by direction.
The analysis of traffic by period and by line makes it possible to identify at a glance the places and times of network saturation, so as to reduce costs without reducing the quality of service.
Indeed, make it possible to understand which regular lines are overcrowded, on which to add races to increase passenger comfort and satisfaction. Conversely, he makes it possible to identify under-frequented lines, which could be switched to On Demand Transportation.
Once the diagnosis is made on network use, the strength of the tool lies in its ability to perform offer simulations, alternative scenarios to the current offer.
In this scenario, we can configure the frequencies of passage and the timetables per line, per period of the year and per time slot. Network use will be simulated according to the proposed offer, and you will be able to assess the relevance of this offer by taking into account the quality of service and operating costs.
Once your alternative scenario has been created, you can save it and create others to compare them with each other. You can also compare your different scenarios with the current offer.
The comparison allows you to evaluate the different adaptation scenarios of the offer in terms of quality of service (comfortable journeys), passenger satisfaction and operating costs (mileage production), and to choose the best offer to put in place according to these parameters.
Why Our Customers Love Transport Planner
Ergonomic, simplifies the diagnosis of an offer
Allows you to understand the network use line by line
Ability to create and test adaptation scenarios
Allows you to compare offers with each other
Reconciles costs and traveler satisfaction
Why Transport Planner?
Our SaaS software makes it possible to create a simple and solid connection between knowledge of mobility demand and supply design tools and methods.
Thanks to the reliable reconstitution of the load on board the vehicles, we have detailed knowledge of the flows and movements within the network, and can simulate these flows according to the adjustments made to the theoretical offer
Facilitate the design of a theoretical offer
10x faster to test adaptations
Up to -10% operating costs
Our other solutions
With Transport Analytics, you can dynamically monitor a large amount of public transport indicators 24/7. You may use them to optimize offers and operations. You can also continuously follow precisely the evolution of origin-destination data, with a large spatio-temporal framework.
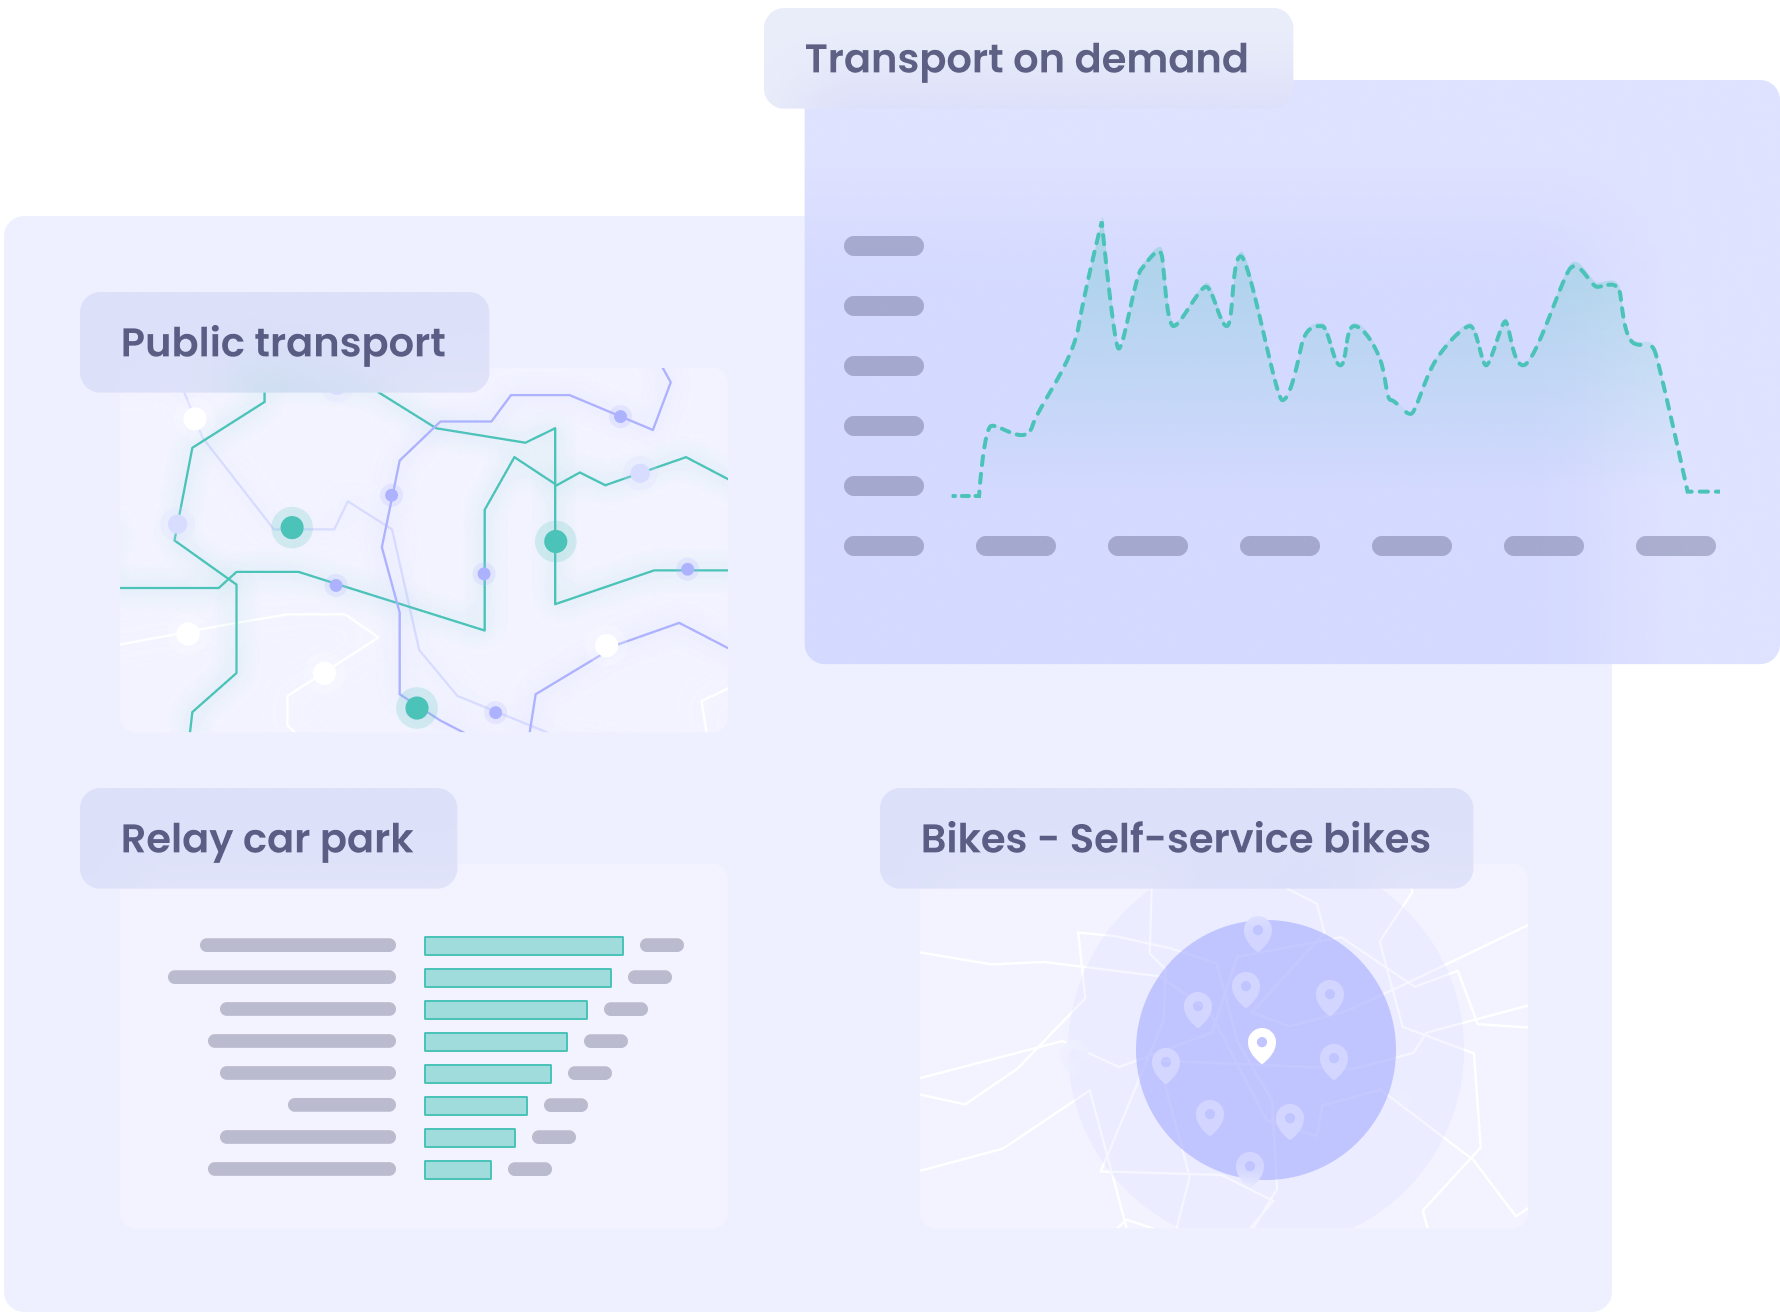
Access a single, turnkey platform that centralizes all multi-source and multi-mode data and indicators. Design and manage a coherent and integrated global mobility policy. Follow travel in your territory and facilitate the complementarity of mobility offers.
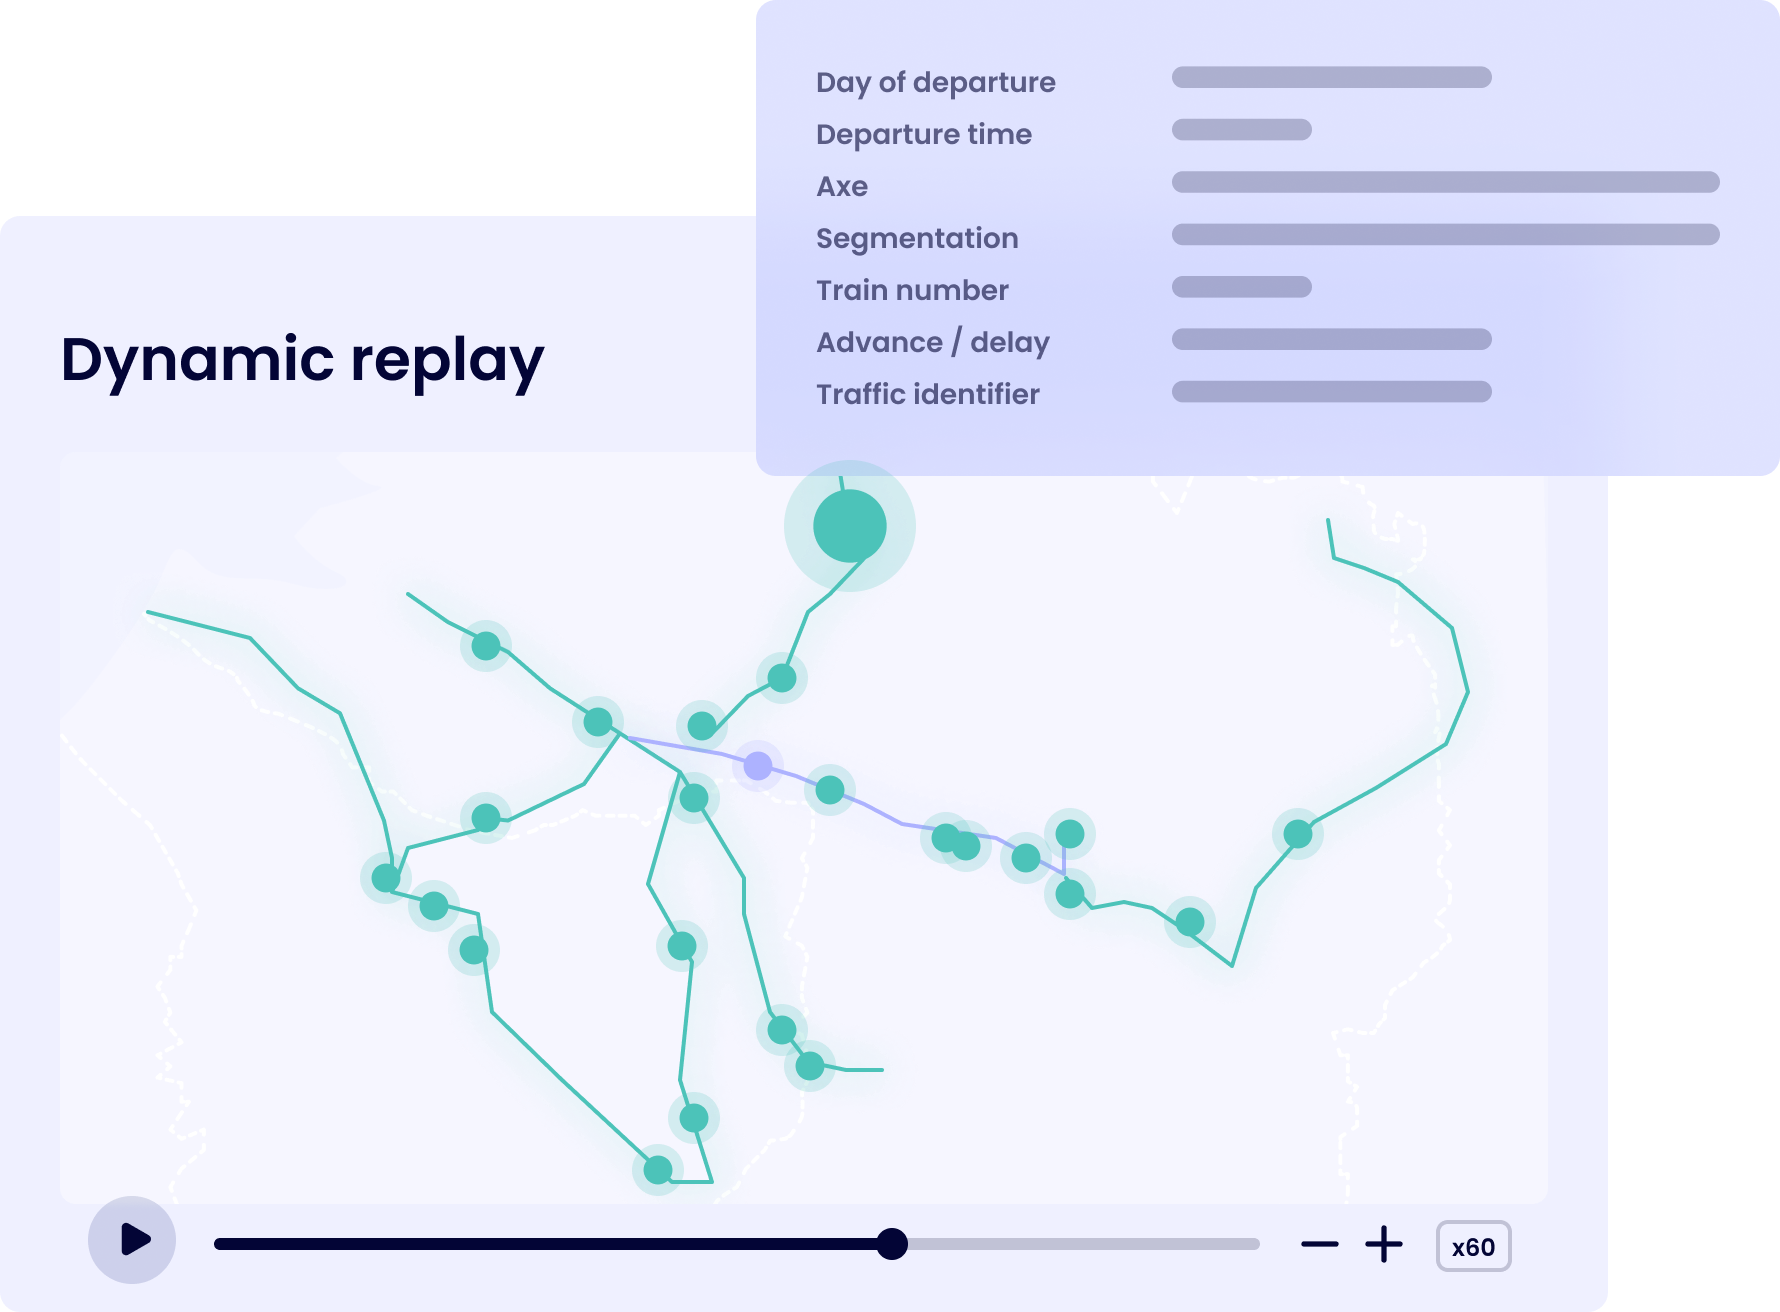
Rail Analytics is a unique platform allowing regions to optimize their regional train offers: monitor network traffic to better adapt offers, ensure the right allocation of rolling stock, anticipate purchase of new equipment, and monitor the quality of production as well as the execution of the offer.
With Fraud Tracker, dynamically follow the evolution of fraud and obtain a more accurate analysis than with field surveys, thanks to the cross-referencing of counting and ticketing data. Thanks to our predictions, facilitate your teams’ work and optimize controls.
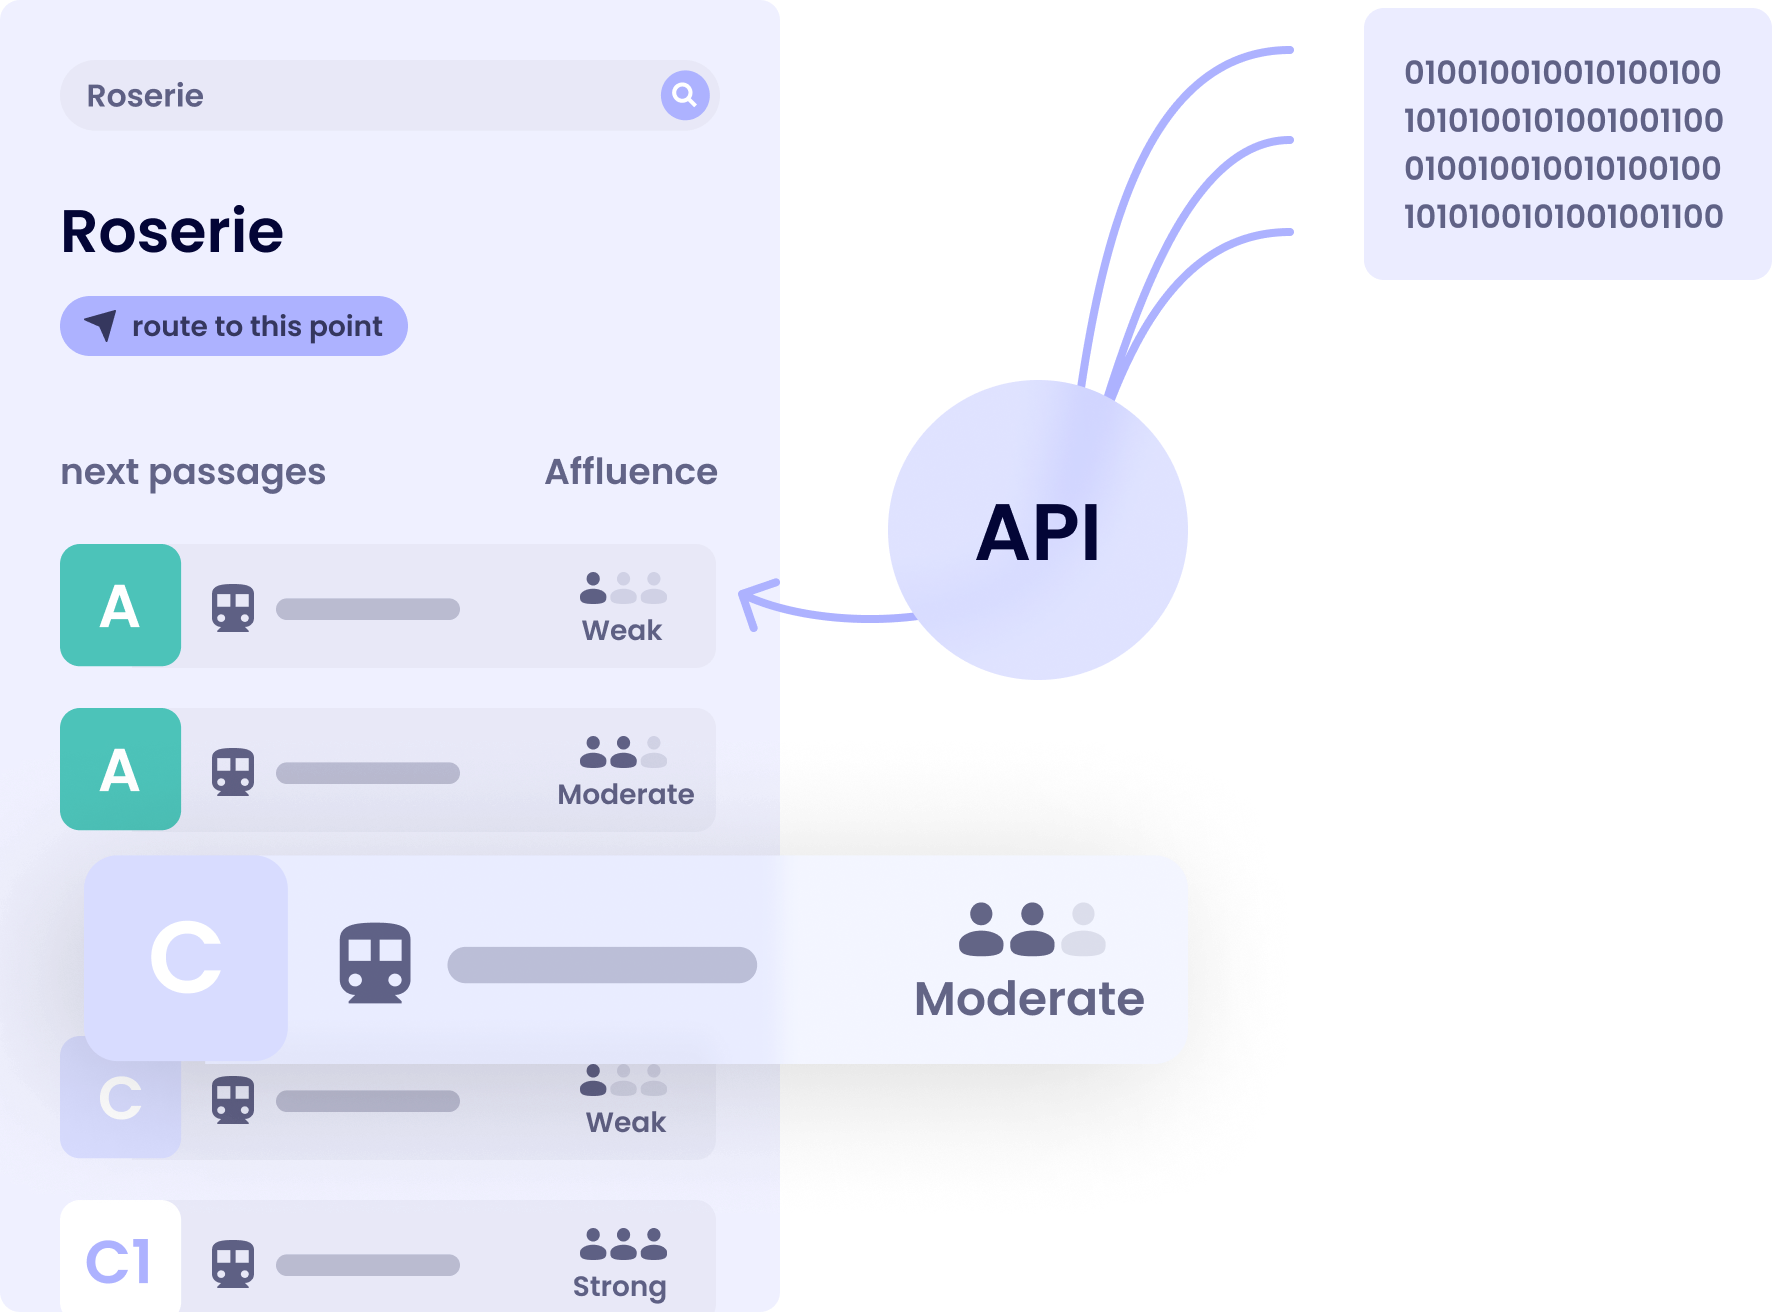
Occupancy API, easy to integrate into a mobile app, improves passenger comfort, and therefore the network attractiveness, by providing reliable information on the number of on-board passengers. This data is used by users to plan routes, and allows the public transport authority and operator to regulate traffic.