Enhance regional trains traffic data, optimize the offer
Optimize your TER network with a better understanding of network use, identify areas for improvement to adjust the offer.
DEMANDER UNE DÉMOWhat is SaaS Rail Analytics software used for?
Rail Analytics is a SaaS solution that allows you to understand and analyze traffic data, by making the data available to the Regional Mobility public transport authorities (AOMR) more reliable, in particular from the counting cells. This data allows the regions to also understand the reality of the operations of the TER network.
Understanding the network allows them to steer the activity and communicate with the various stakeholders. The regions can thus manage investments in rolling stock, validate the level of service of the operator(s), have information on the network and its operation in a more regular and exhaustive manner, share information with elected officials, and adjust as best as possible. the supply of regional trains to the demand for passenger mobility.
Make counting data more reliable to enable their analysis
Failure to provide complete information: this is the problem faced by many Regional Mobility public transport authorities (AOMR).
The first step, before anything else, is therefore to make the data from the counting cells more reliable, to obtain information both on the realization of the offer by the operator to improve management, and on network use to understand citizens’ demand for mobility and adapt the offer accordingly.
CONTACT US TO KNOW +
Features: Everything you can do with Rail Analytics

Embarking / Disembarking and the load on board
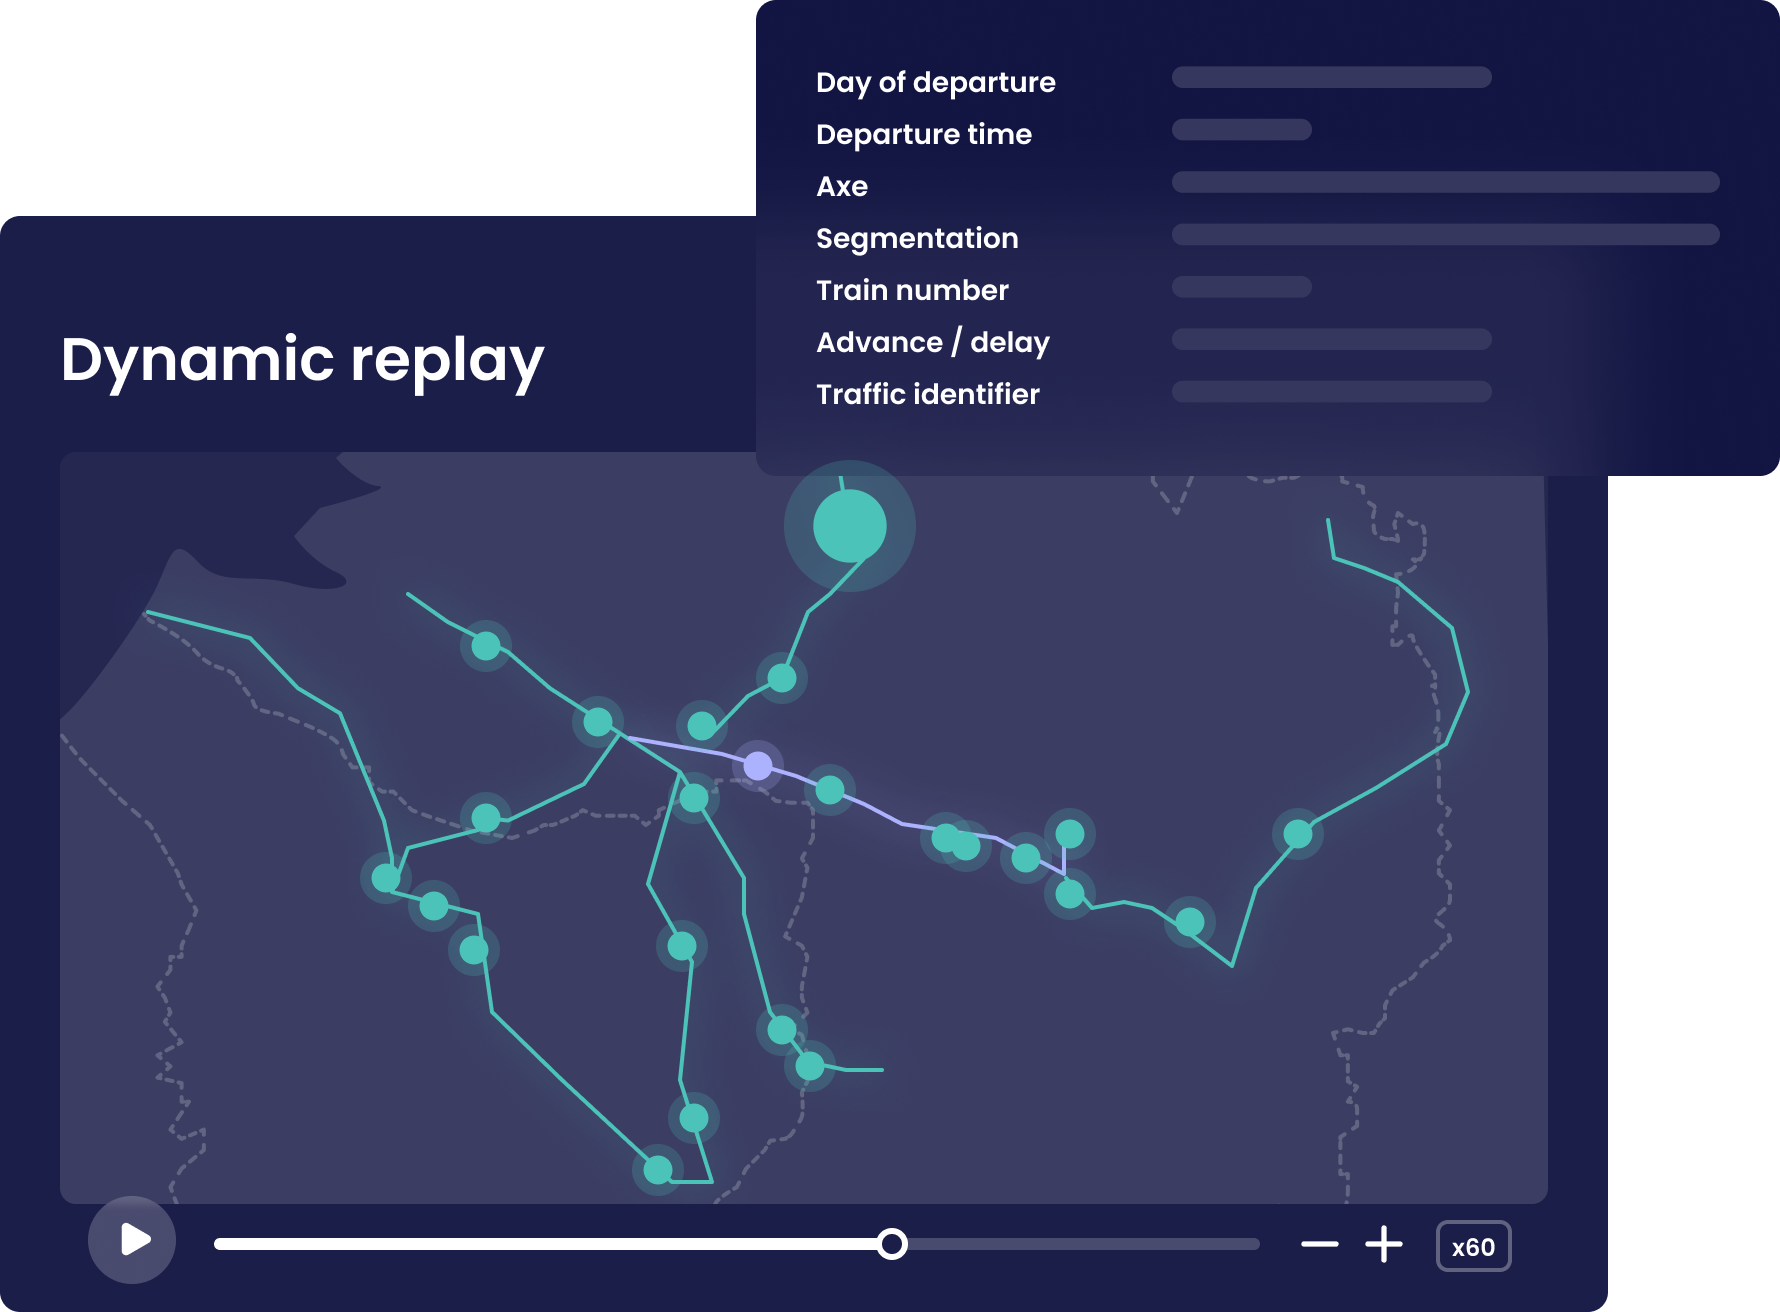
The dynamic dashboard

Comprehensive vision of network use

Monitor the realization of the offer with various indicators
In the Frequentation module, the embarking and disembarking indicators by axis or station, as well as the on-board load indicator, make it possible to monitor network use to better adapt supply to demand.
These indicators are included in the Traffic module, which displays the details of all traffic carried out for an axis, a direction and/or a segmentation over a day. Travel time and punctuality information are added to it, to have an overall view by train and by train.
Dashboard is the network’s weather. View key indicators at a glance to monitor network activity and performance, and make the best decisions in an agile and fast way.
This module allows you to answer in a very pragmatic way the questions you may ask yourself: are the trains running well? Are they on time? Which axes are overloaded? What are the axes with the most delays?
Most rail transport networks have less than 30% of their trains equipped with counting cells of travelers. From this partial data, how to know the network use on all traffic?
Our extrapolation algorithms provide an exhaustive view of network use, and not only on circulations equipped with counting cells. Find below, in the “How does it work?” section, the details.
Monitor operational performance indicators : advances / delays, punctuality, number of circulations, travel time, and downtime.
This relevant and easily usable information allows you to make informed decisions and better manage the realization of the offer by the operator. Use this data to optimize the regional train network, guarantee passenger satisfaction and the efficiency of the offer.
Why Our Customers Love Rail Analytics
Ergonomics, simple & fluid search for information
Dynamic and regularly updated data
The ability to value reliable data
The ability to communicate with elected officials and internally
The dynamic dashboard for daily monitoring
Why Rail Analytics?
Rail Analytics is the only SaaS software that offers you a complete solution for managing the operation of the regional train network and dynamically changing the offer with passenger needs. With this tool, analyze network use, optimize the allocation of rolling stock, anticipate the purchase of equipment and monitor the quality of production and the realization of the offer.
Simpler
More ergonomic
More user-friendly
Our other solutions
With Transport Analytics, you can dynamically monitor a large amount of public transport indicators 24/7. You may use them to optimize offers and operations. You can also continuously follow precisely the evolution of origin-destination data, with a large spatio-temporal framework.
With Transport Planner, find and test the optimal transport offer: identify at a glance overloaded routes, places and times when the network is saturated, and test optimization hypotheses by increasing the frequency and comparing various service adaptation scenarios.
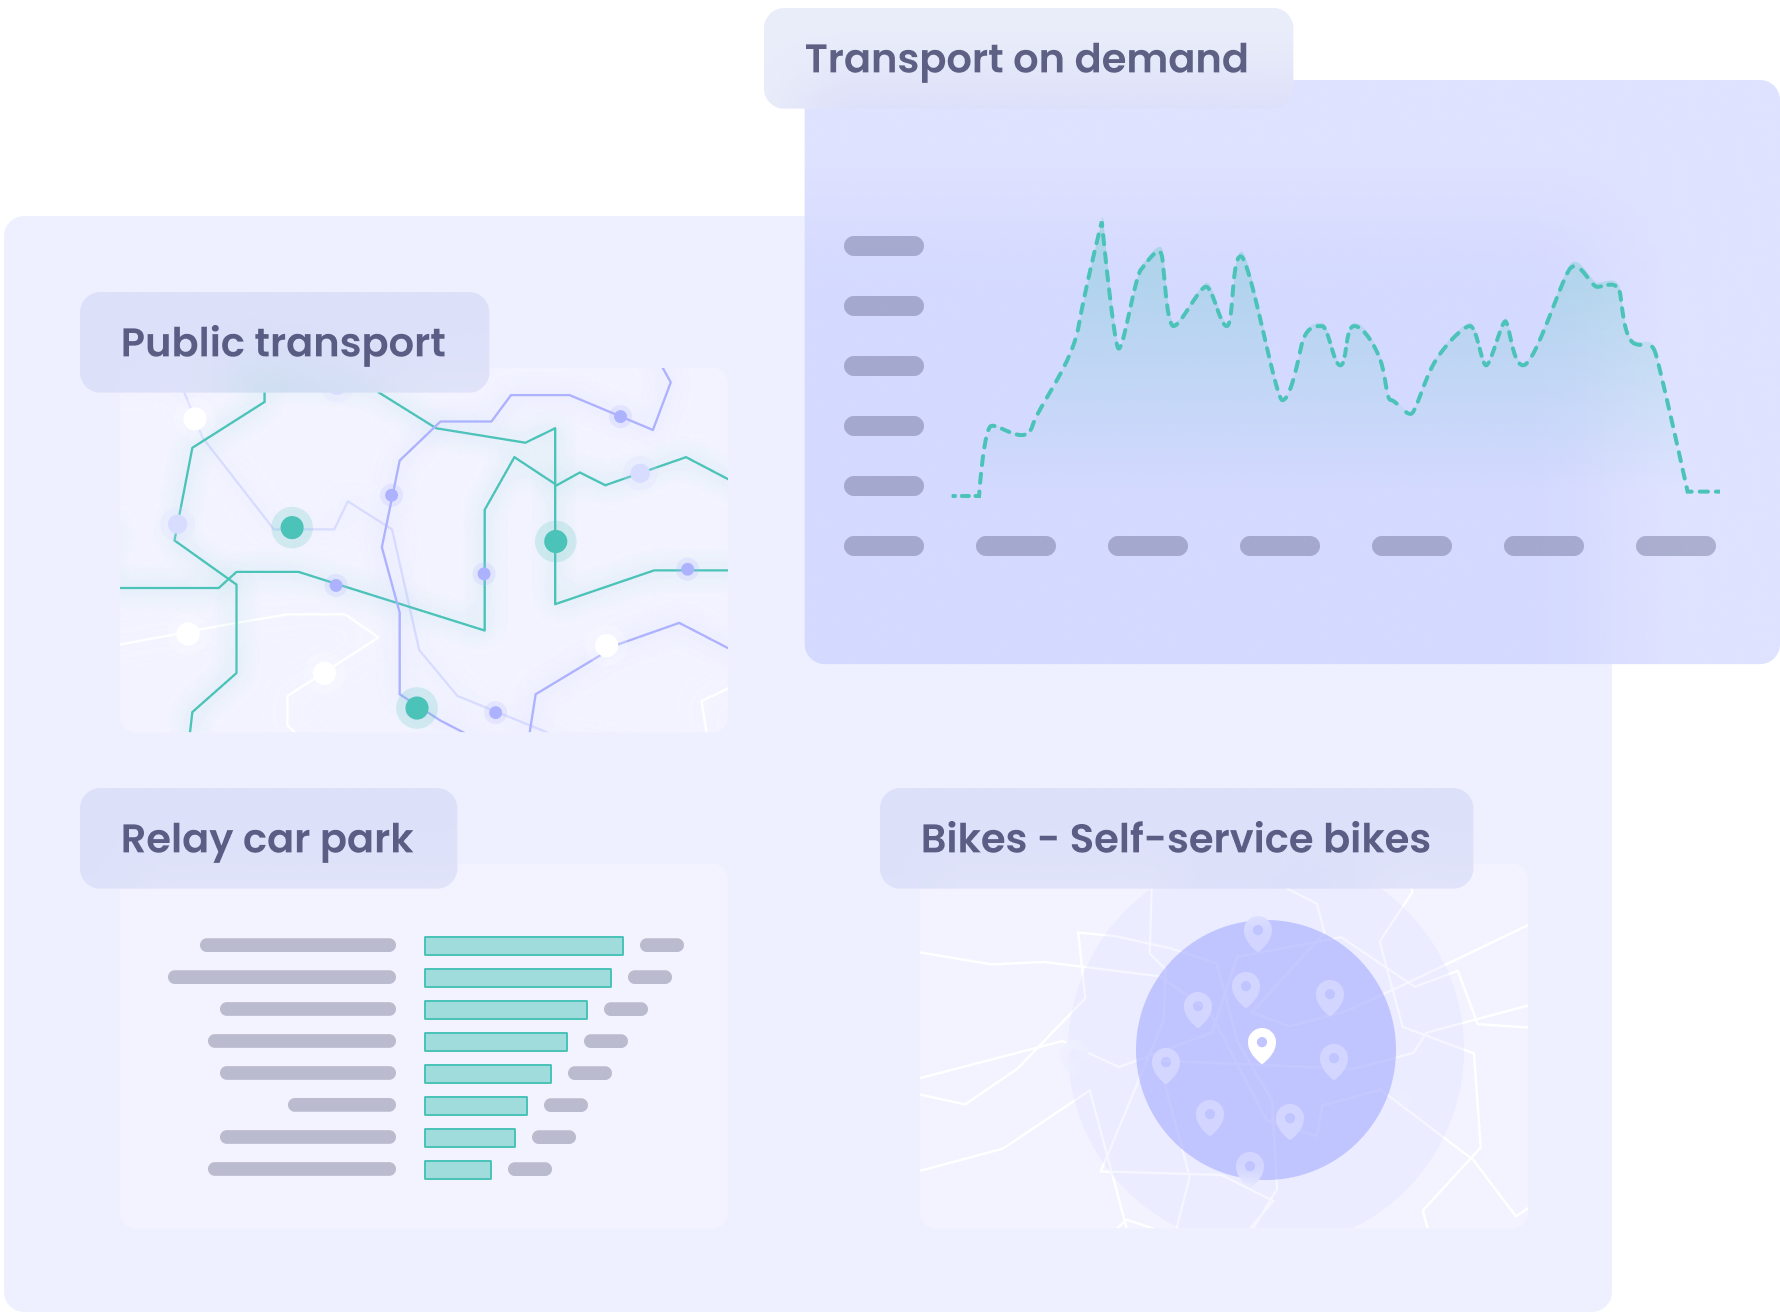
Access a single, turnkey platform that centralizes all multi-source and multi-mode data and indicators. Design and manage a coherent and integrated global mobility policy. Follow travel in your territory and facilitate the complementarity of mobility offers.
With Fraud Tracker, dynamically follow the evolution of fraud and obtain a more accurate analysis than with field surveys, thanks to the cross-referencing of counting and ticketing data. Thanks to our predictions, facilitate your teams’ work and optimize controls.
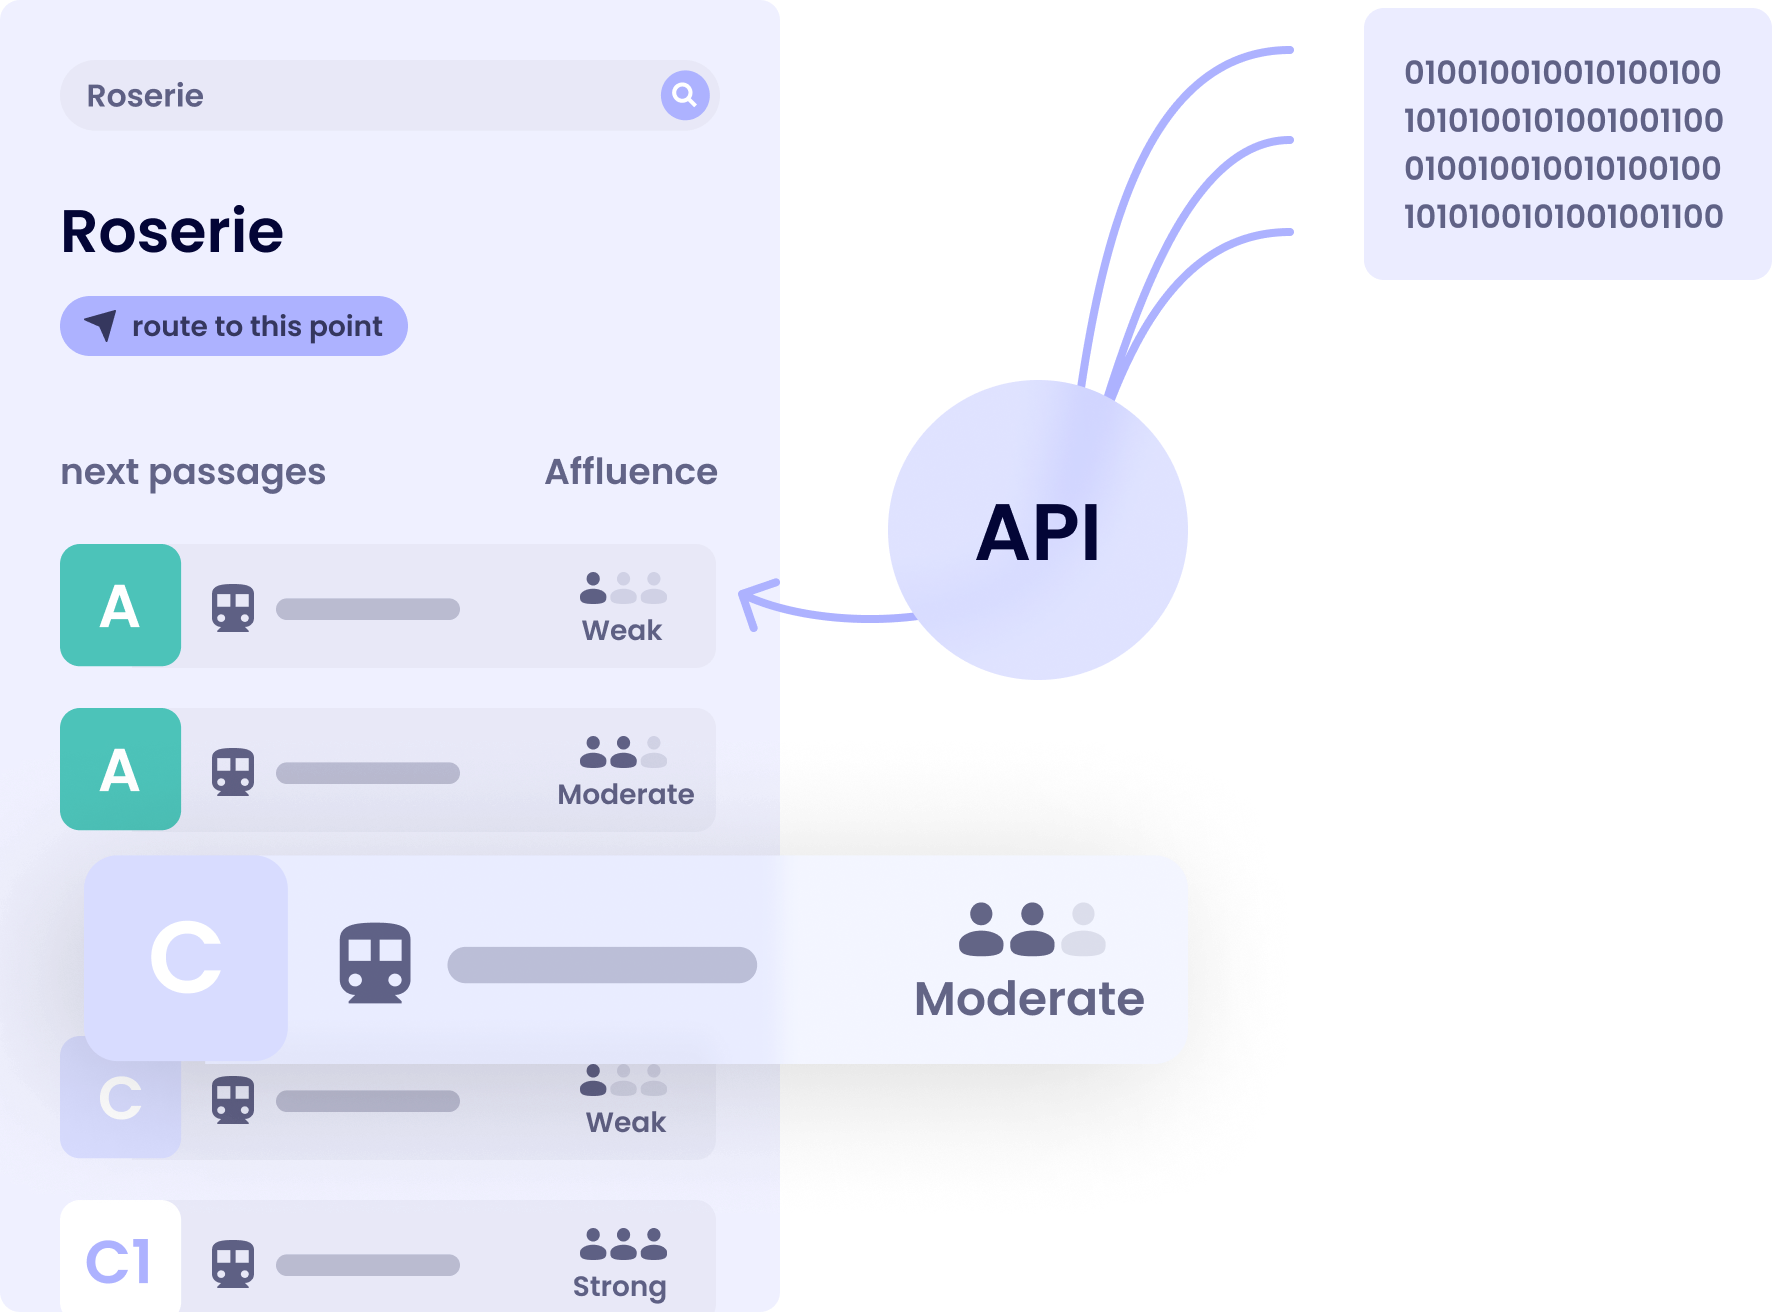
Occupancy API, easy to integrate into a mobile app, improves passenger comfort, and therefore the network attractiveness, by providing reliable information on the number of on-board passengers. This data is used by users to plan routes, and allows the public transport authority and operator to regulate traffic.