Predict traffic on board vehicles and share it easily
An easy-to-integrate API, which improves the traveler experience and regulates network use in public transport.
REQUEST A DEMOWhat is the Occupancy API programming interface for?
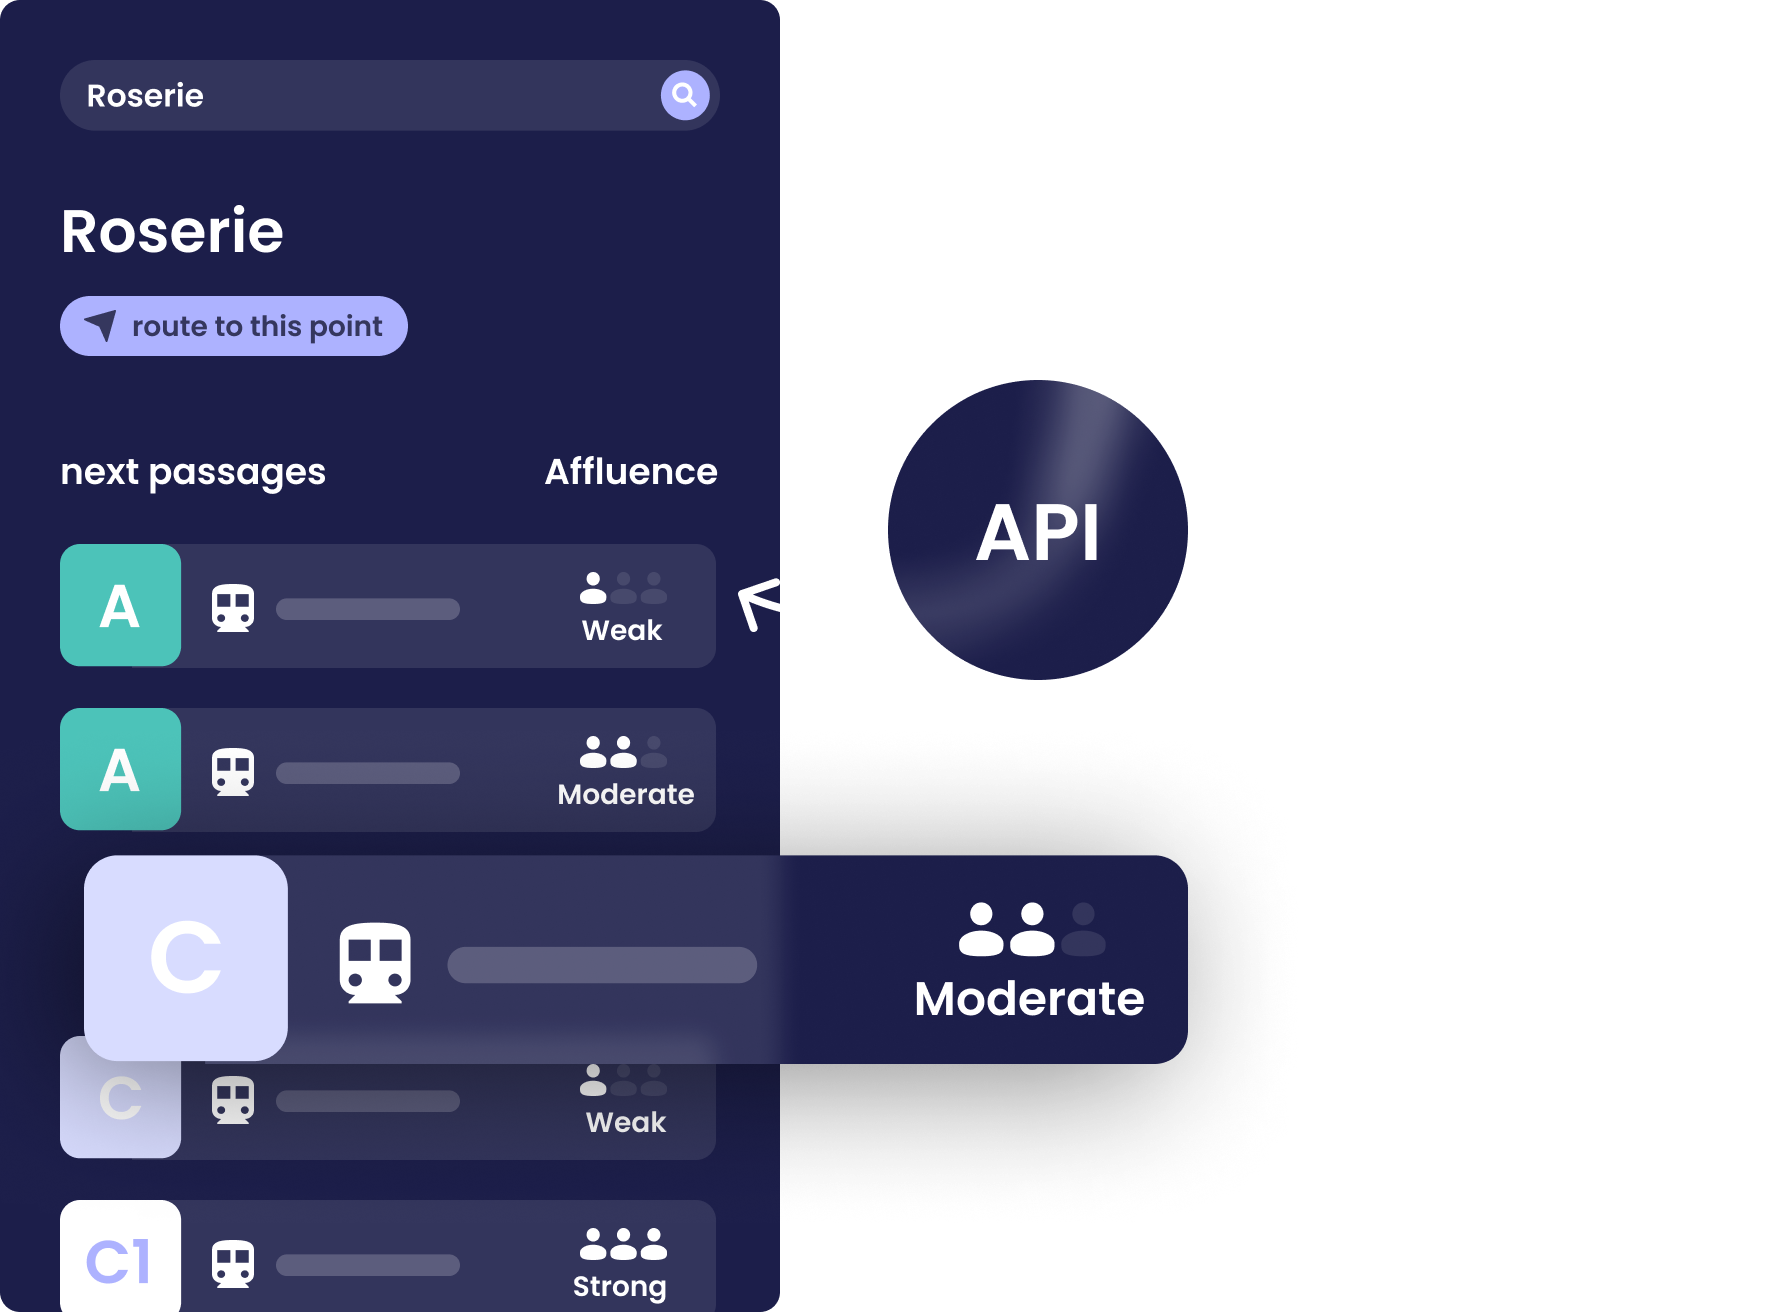
As an Organizing Authority or Mobility Operator, you can, thanks to Occupancy API, accurately predict the load on board vehicles and communicate it to users.
Indeed, the pandemic has caused a decrease in the attractiveness of public transport for citizens who fear closed and saturated spaces. The majority of transport networks did not recover the level of network use before the crisis. With this solution, you will be able to have reliable network use predictions and easily inform travelers about the load on board at all stages of their trip, and thus reassure them.
Predict traffic, to better distribute the load and anticipate the network evolution
Thanks to Occupancy API, you can accurately anticipate traffic on your network and adapt the offer accordingly. With this solution, you will be able to have network use predictions and inform travelers about the load on board at all stages of their trip.
CONTACT US TO KNOW +
Features: Everything you can do thanks to Occupancy API

Predict the load on board vehicles in transport

Co-building, the key for this project

Regulate traffic on the network

Have a direct impact on user behavior
Optimize your public transport network and your daily operations thanks to crowd predictions.
Indeed, with Occupancy API, you can spread load peaks by encouraging the transfer to another schedule or another mode, reassure your travelers while strengthening the attractiveness of your network, anticipate crowds and adapt your transport offer. accordingly, and anticipate under crowding and reduce supply to save money without lowering the quality of service.
Occupancy API is an application programming interface, not software as such. In a multi-party project with the AOM, the operator, and the MaaS solution provider, it is important to us to simplify its implementation with a documented solution and teams available to our stakeholders.
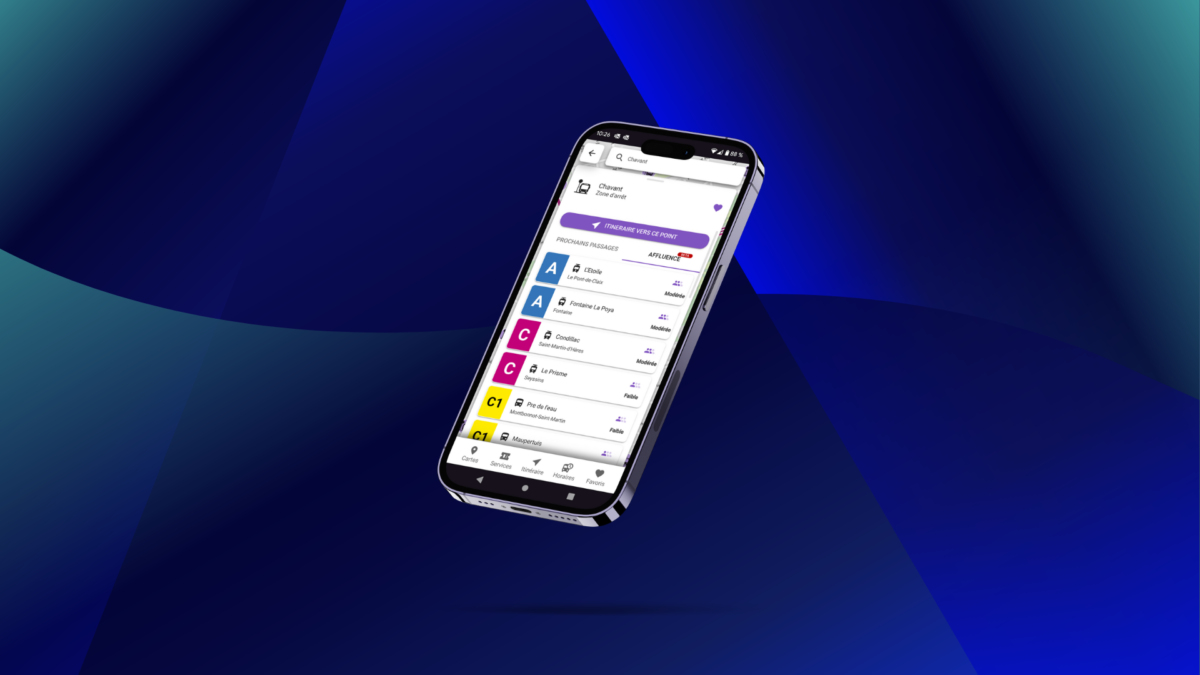
We have worked with a specialized design agency to advise our clients on how to highlight traffic information in the most readable way possible for users of the service.
To save time, travelers take the first bus that arrives, even overloaded, while the next one may be less full. This phenomenon irritates travelers and makes it difficult for drivers to respect travel times.
Occupancy API allows to make predictions available influx of drivers and the service responsible for regulation. The drivers can thus adapt their races, with the support of the regulators who would help them thanks to their global vision of the network.
By providing reliable information on the load on board vehicles, you allow travelers to travel in the best possible conditions, you increase their comfort and satisfaction.
Indeed, they can be reassured on the fact that the affluence is reasonable and allows the actions to be applied barriers. They can also choose routes or more comfortable travel times. For example, they can estimate whether seated places will be available, which is important for people with access difficulties.
Why our customers love Occupancy API
Regulate the crowds on board vehicles
Communicate on board crowds to travelers
Reassure public transport users
Improve passenger comfort and satisfaction
Anticipate changes to the network to be implemented
Why Occupancy API?
The prediction is based on Artificial Intelligence and Big Data technologies and is made from ticketing data and/or from counting cells. This hybrid solution thus makes it possible to predict a load rate over the entire network, even if all the vehicles are not equipped with metering cells.
90% accuracy on onboard loads
1 in 5 people use this feature
-10% saturation peaks
+20% increase passenger comfort
Our other solutions
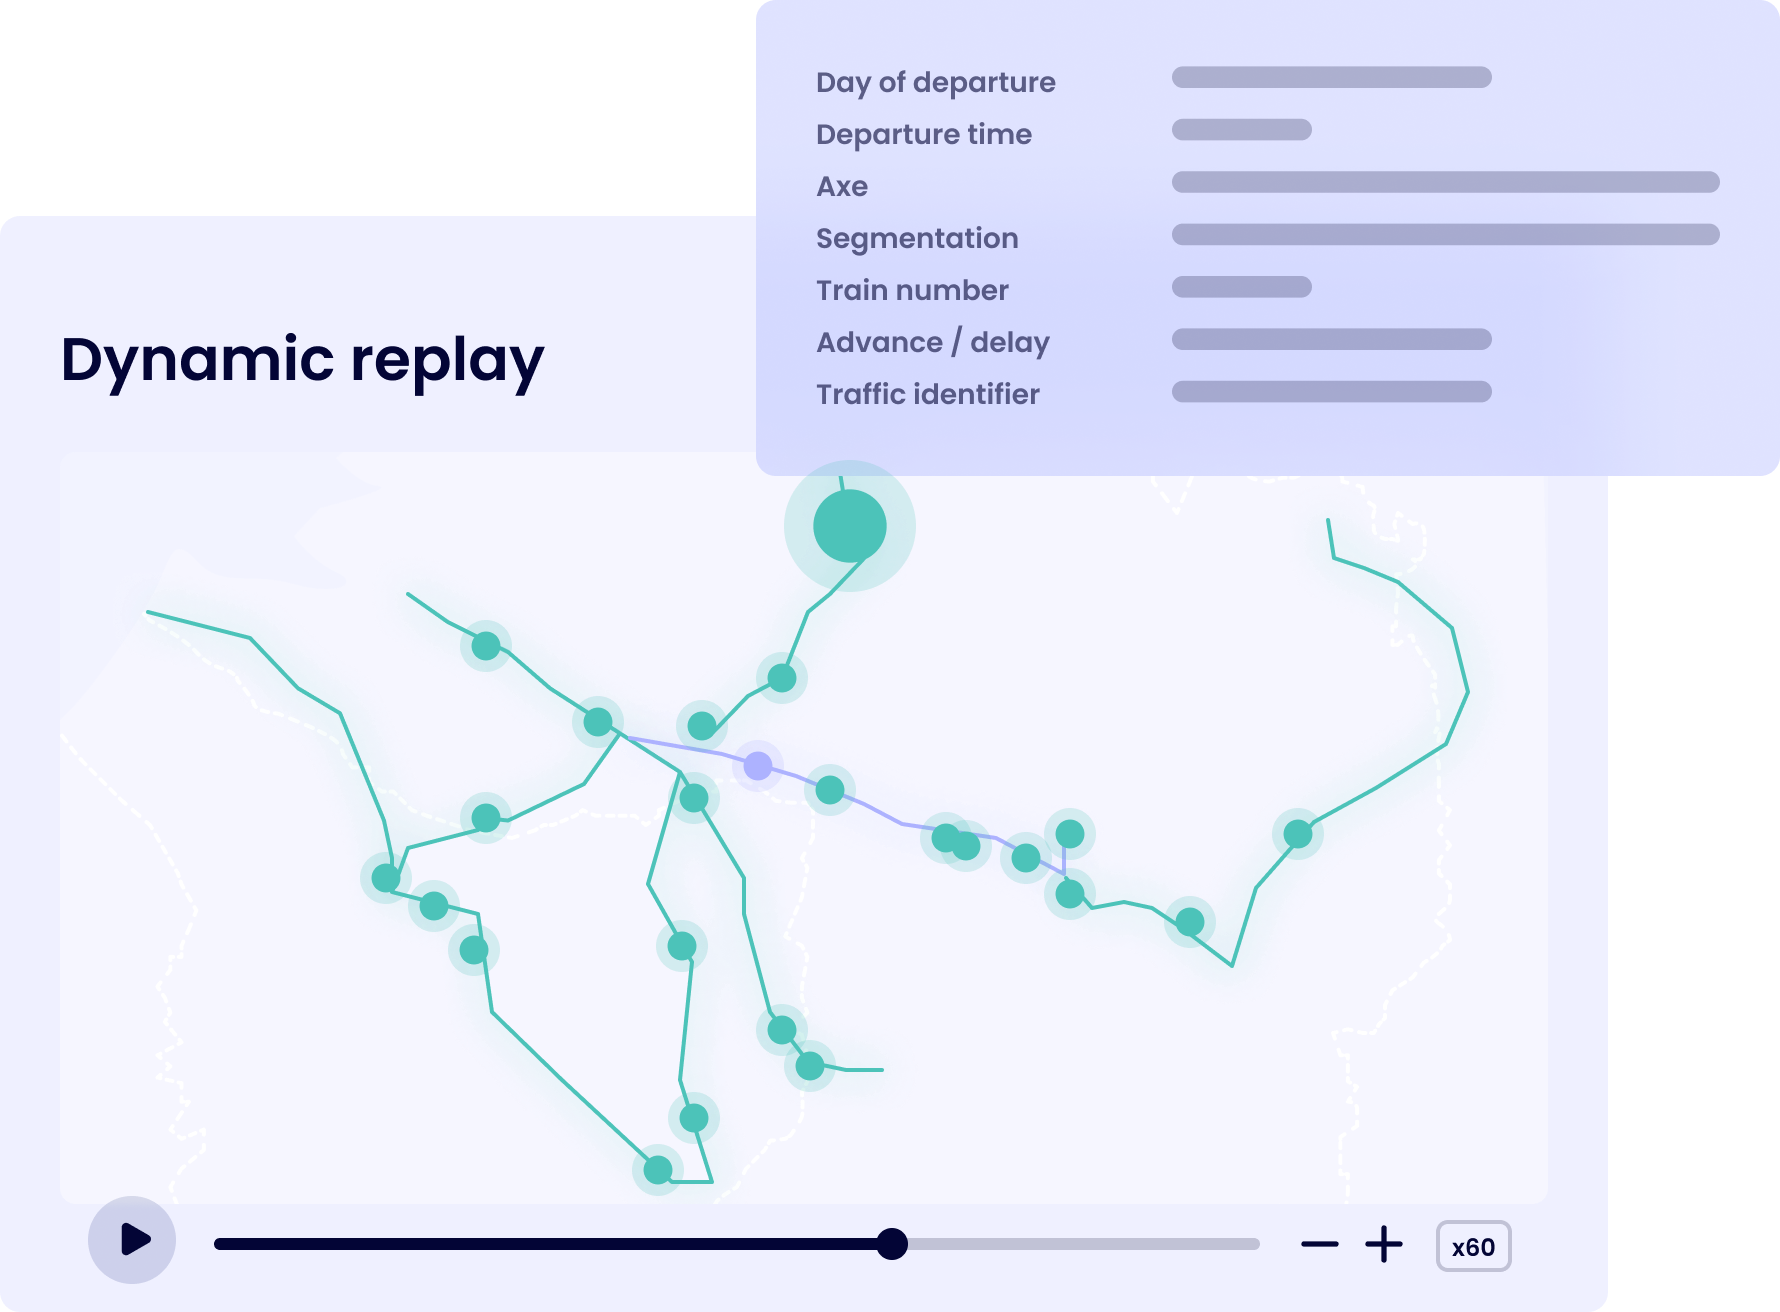
With Transport Analytics, you can dynamically monitor a large amount of public transport indicators 24/7. You may use them to optimize offers and operations. You can also continuously follow precisely the evolution of origin-destination data, with a large spatio-temporal framework.
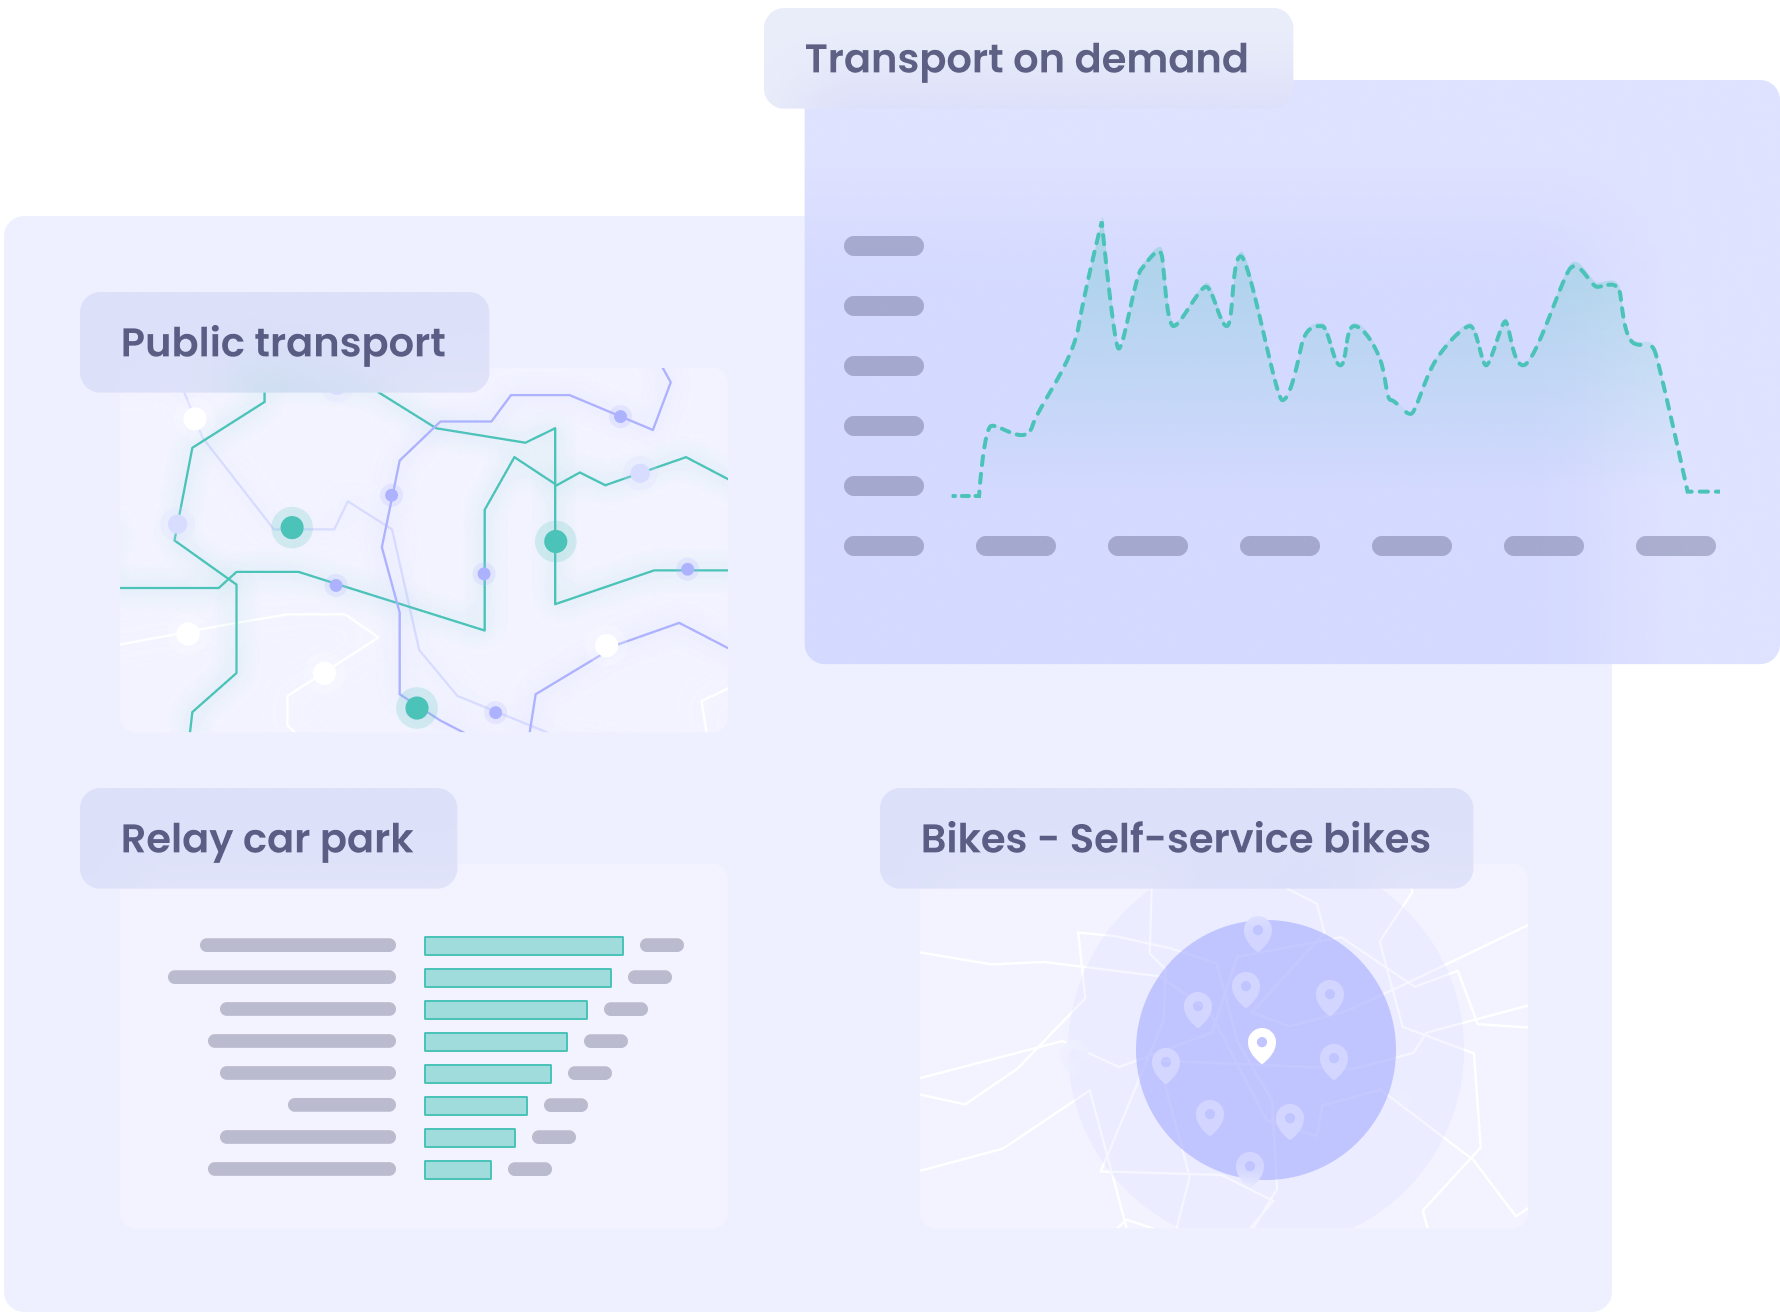
Access a single, turnkey platform that centralizes all multi-source and multi-mode data and indicators. Design and manage a coherent and integrated global mobility policy. Follow travel in your territory and facilitate the complementarity of mobility offers.
Rail Analytics is a unique platform allowing regions to optimize their regional train offers: monitor network traffic to better adapt offers, ensure the right allocation of rolling stock, anticipate purchase of new equipment, and monitor the quality of production as well as the execution of the offer.
With Fraud Tracker, dynamically follow the evolution of fraud and obtain a more accurate analysis than with field surveys, thanks to the cross-referencing of counting and ticketing data. Thanks to our predictions, facilitate your teams’ work and optimize controls.
With Transport Planner, find and test the optimal transport offer: identify at a glance overloaded routes, places and times when the network is saturated, and test optimization hypotheses by increasing the frequency and comparing various service adaptation scenarios.