Monitor, manage and optimize your public transport network
With Transport Analytics, easily and dynamically access all the essential data of your network, aggregated and made reliable.
REQUEST A DEMO
What is the SaaS platform Transport Analytics used for?
As a Public Transport Authority (PTA), you can continuously monitor your public service delegation with Transport Analytics. This can be done in complete autonomy and transparency. Transport Analytics is an ergonomic interface developed by data and transport specialists. It becomes a trusted third party and strengthens your analytical capabilities.
As a Public Transport Operator (PTO), you can spend more time on continuous analysis and optimization of the network with Transport Analytics. You can also spend less time on data processing and reporting. You can communicate more effectively with your principal to strengthen your relationship of trust.
Understanding your transportation network in depth and optimizing it
Track the evolution of transportation traffic, your operational performance indicators, and see the replay of a day in operation dynamically. For more detailed analyses, you can access indicators in detail for each stop and trip, as well as for the entire network ; also data is available by quarter-hour or for the full year.
CONTACT US TO KNOW MORE
Features: Everything you can do with Transport Analytics

Operational performance: follow your indicators

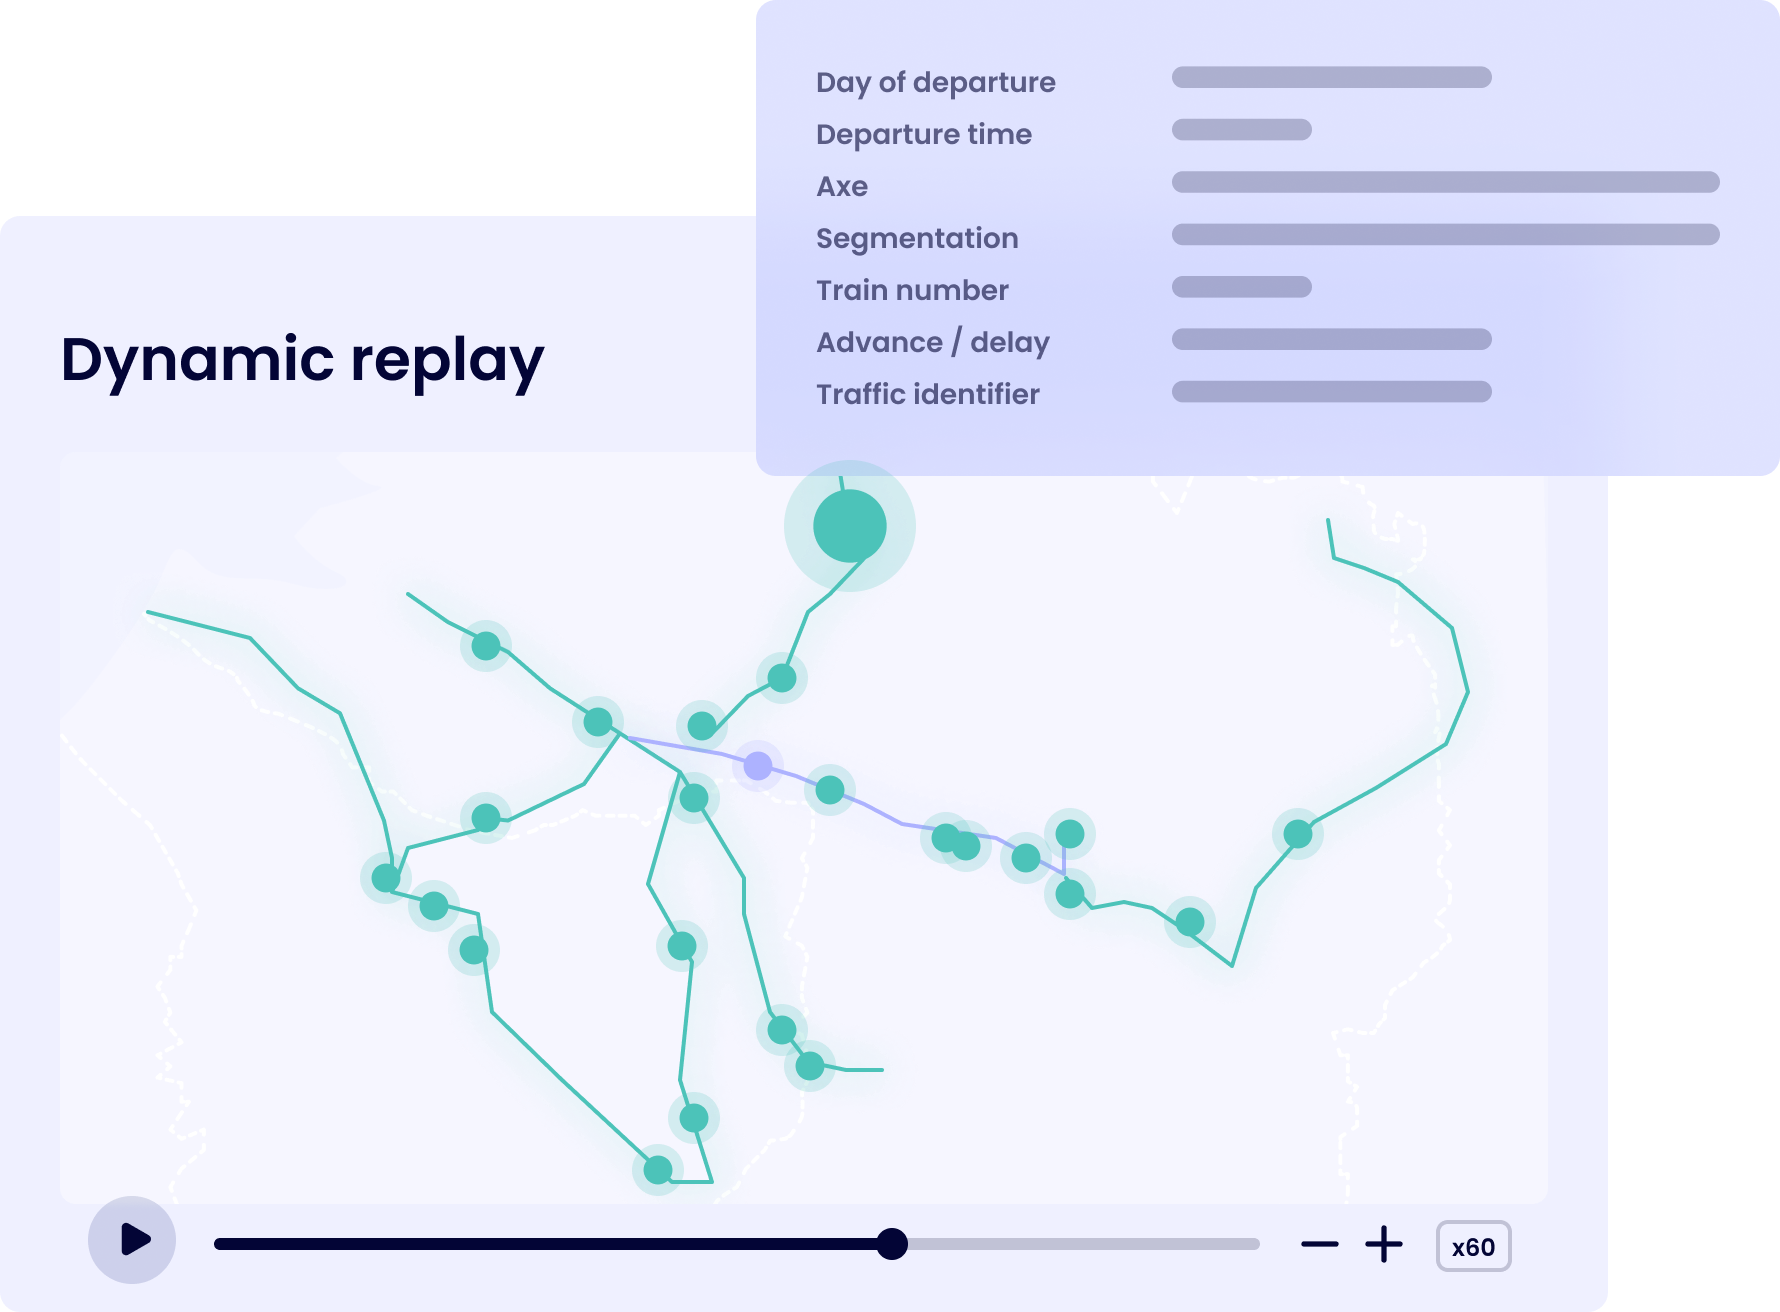
Replay and races: relive a day of operations

Occupancy, movement flows
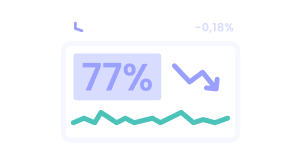
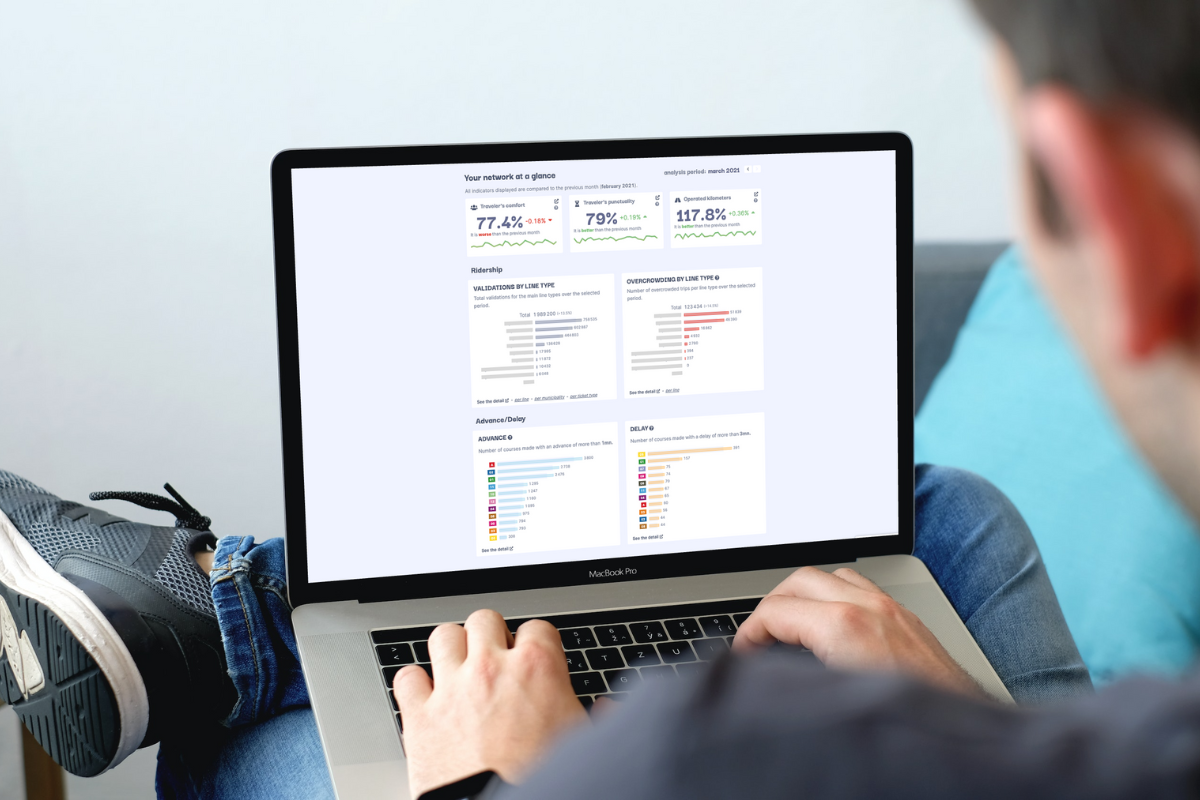
Dashboard: overview of network indicators
Monitor various operational performance indicators such as journey time, punctuality, regularity, commercial speed, kilometric production, and carbon footprint.
This information is essential and easily accessible for making well-informed decisions to improve your operational efficiency. Utilize the data to optimize your transportation network, ensuring passenger satisfaction and network efficiency.
With dynamic replay, you can visualize detailed and overall daily operations. This feature provides a quick and visual overview of your preferred indicators for all rides.
To help you with your analyses, you can find important metrics such as advances, delays, and on-board load, displayed in an ergonomic and easy-to-understand manner. This allows you to identify areas of improvement and optimize the transport network more efficiently.
You can track the evolution of network usage by using our travel reconstruction method based on ticketing data. How do we do that ? Click here to learn more and discover our resources on this subject.
Visualize the validations, Origins-Destinations, loads, and boarding/disembarking data. These indicators are available with various formats and filters, for both a general and detailed understanding of travel within the region. By analyzing them, you can optimize your offers by identifying sources of savings such as under-capacity runs and unnecessary duplication, as well as exploit new sources of potential revenue.
The dashboard can be compared to a weather report for a network. It enables you to visualize key indicators and manage network activity in an agile and efficient manner, without relying on traditional reporting deadlines.
This module serves as a mobility observatory, helping you to answer important questions such as “Are the vehicles circulating well?” and “Are they on time?“.
Why Our Customers Love Transport Analytics
Offers precise, efficient, and continuous analysis
Reliably processes data and verifies its accuracy
Ergonomic design with graphic views and maps
Shared data visualization with a trusted 3rd party
Relevant indicators are relevant & can be customized
Why Transport Analytics?
Since 2018, we have been harnessing the power of big data and putting it in your hands. With our ergonomic design platforms, you can analyze your public transportation network, pinpoint its strengths and weaknesses, and make informed decisions to improve operational efficiency and enhance the passenger experience.
Dual expertise in both data & transportation
2 to 3 FTEs saved per year on average
Between 15k€ and 200k€ savings per year
Our other solutions
With Transport Planner, find and test the optimal transport offer: identify at a glance overloaded routes, places and times when the network is saturated, and test optimization hypotheses by increasing the frequency and comparing various service adaptation scenarios.
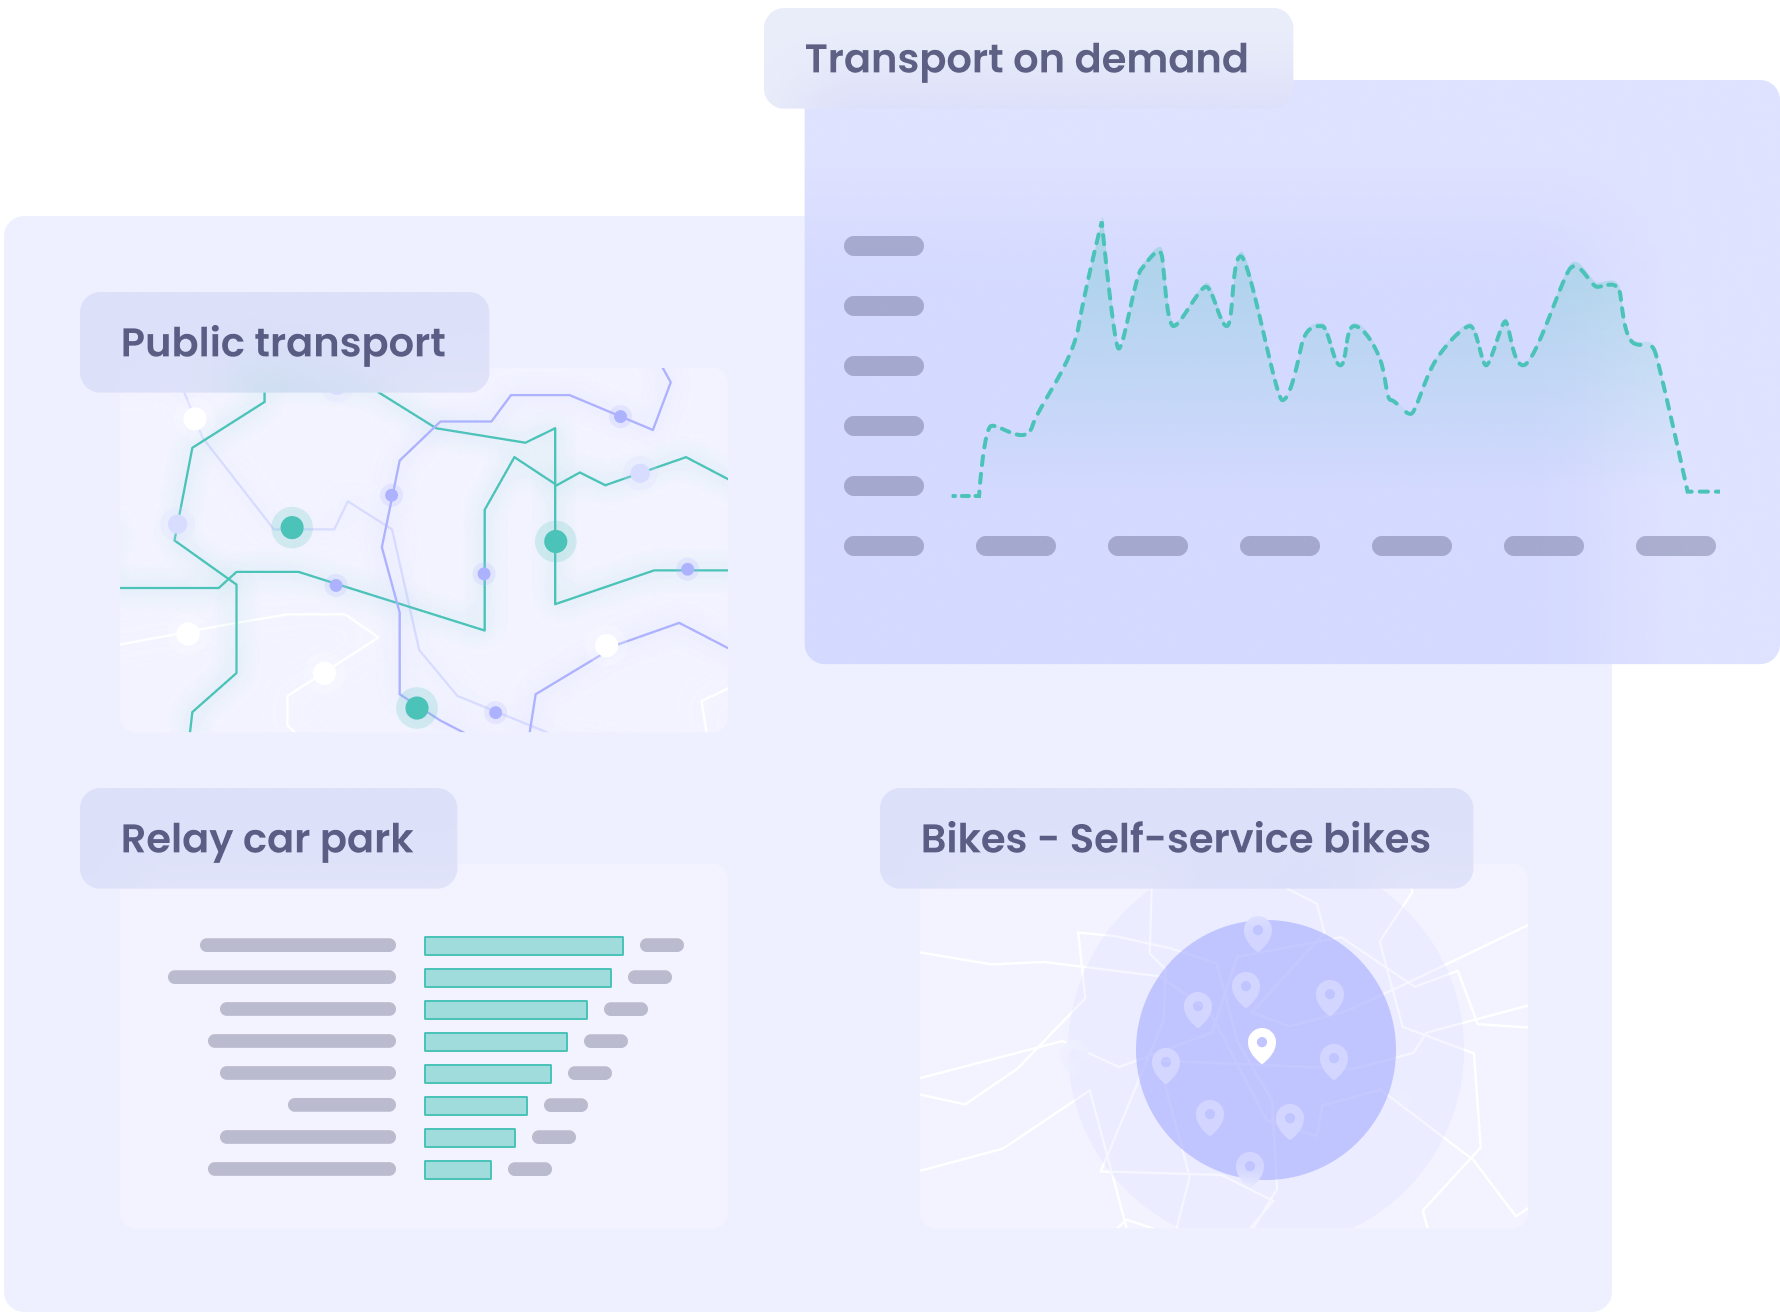
Access a single, turnkey platform that centralizes all multi-source and multi-mode data and indicators. Design and manage a coherent and integrated global mobility policy. Follow travel in your territory and facilitate the complementarity of mobility offers.
Rail Analytics is a unique platform allowing regions to optimize their regional train offers: monitor network traffic to better adapt offers, ensure the right allocation of rolling stock, anticipate purchase of new equipment, and monitor the quality of production as well as the execution of the offer.
With Fraud Tracker, dynamically follow the evolution of fraud and obtain a more accurate analysis than with field surveys, thanks to the cross-referencing of counting and ticketing data. Thanks to our predictions, facilitate your teams’ work and optimize controls.
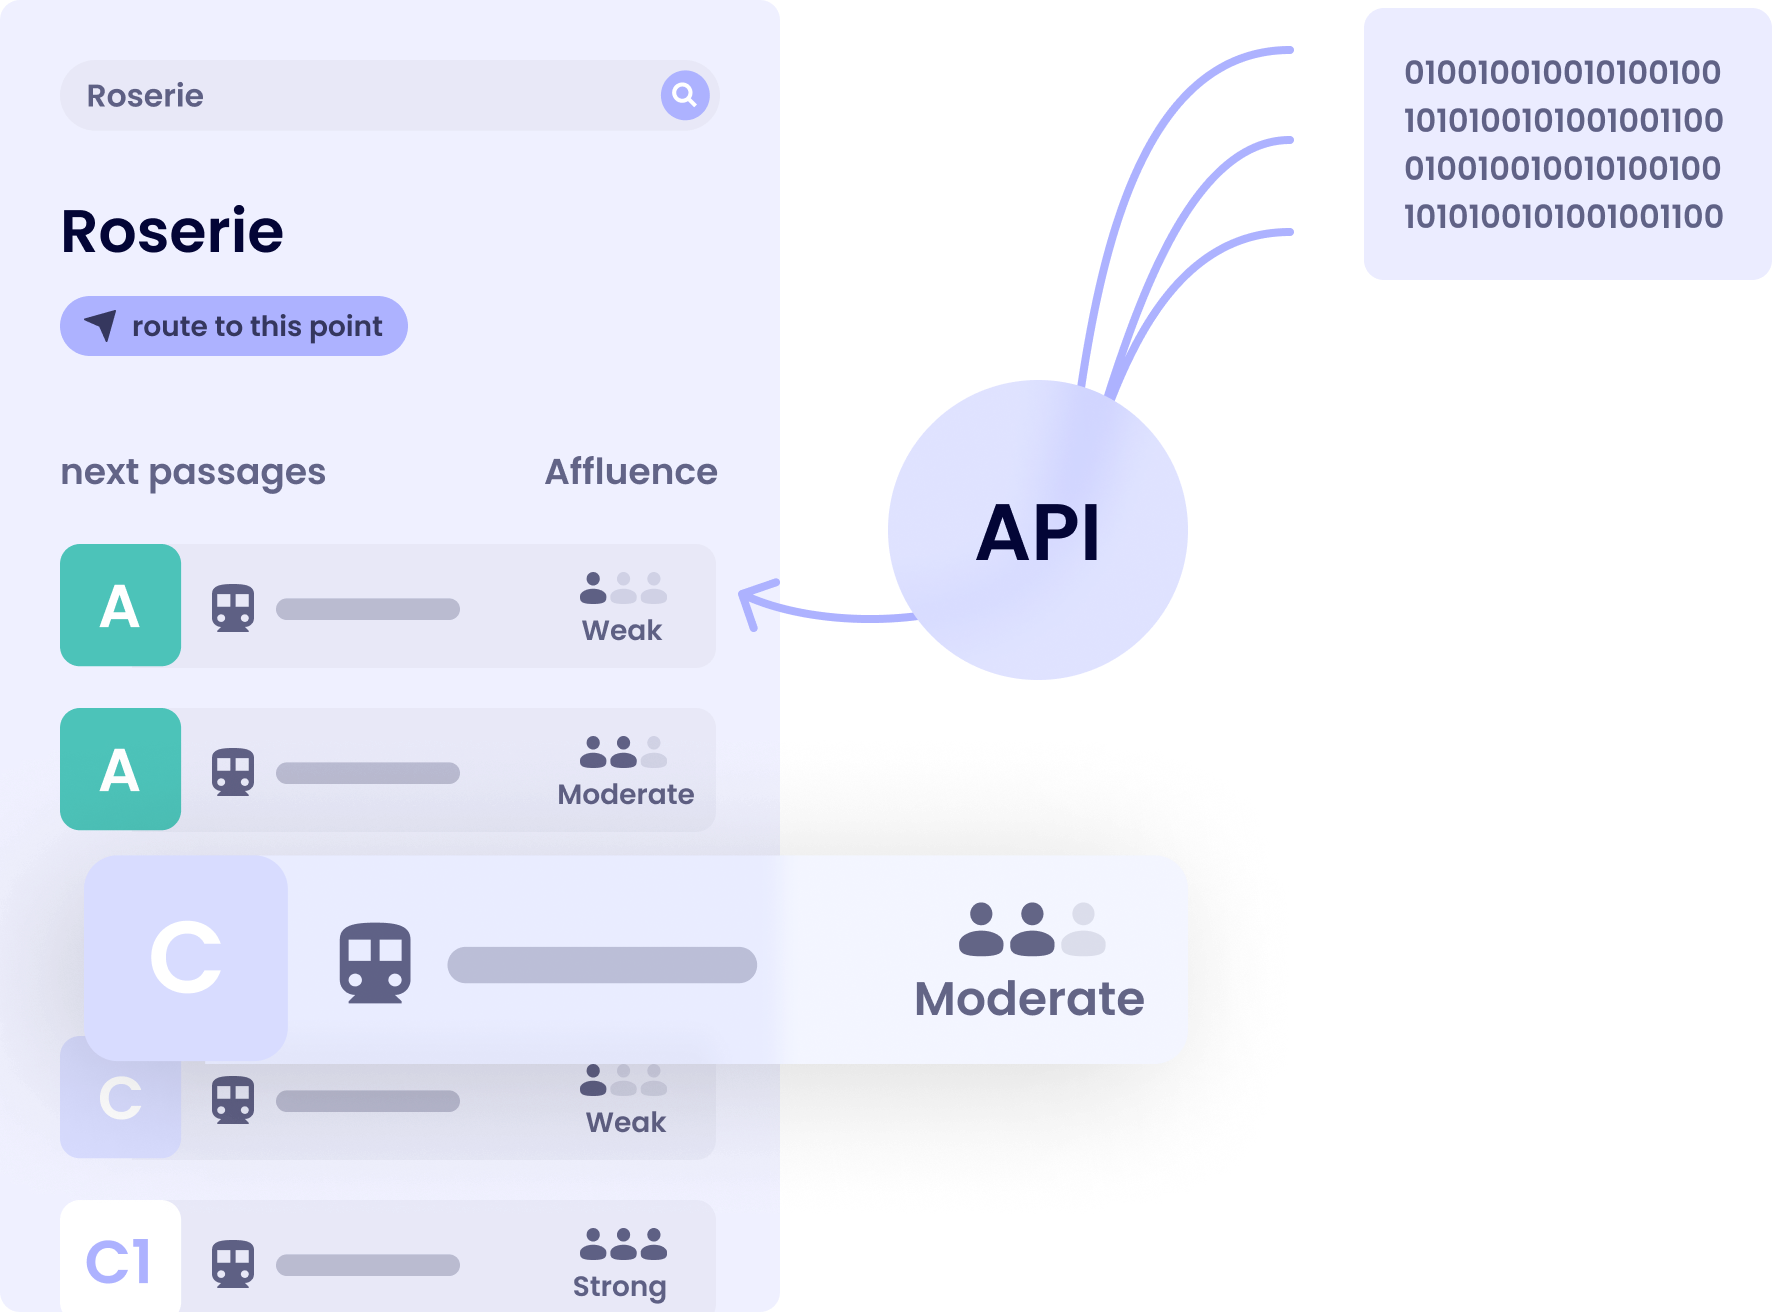
Occupancy API, easy to integrate into a mobile app, improves passenger comfort, and therefore the network attractiveness, by providing reliable information on the number of on-board passengers. This data is used by users to plan routes, and allows the public transport authority and operator to regulate traffic.